
Image
|
Figure Caption
Fig. 3
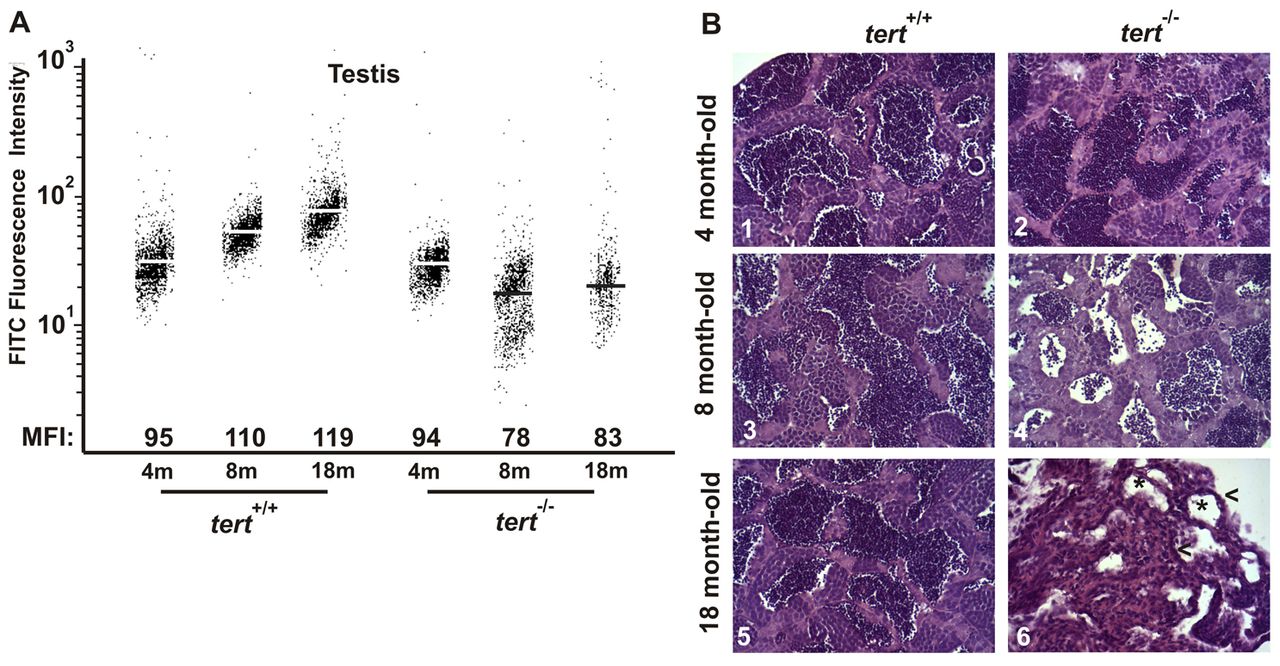
Premature alterations of the testis tissue of tert mutant zebrafish. (A) Representation of testis cell distribution from the wild-type and tert mutant genotype according to their telomere length. Medium fluorescence intensity (MFI) is indicated for each genetic background. The same trend was observed in the three independent experiments. (B) Representative image of zebrafish testis (n=3) from tert+/+ and tert-/- backgrounds at 4, 8 and 18 months old (200×). Asterisks in panel 6 indicate atrophic tubules, and arrowheads atrophic stroma.
Figure Data
Acknowledgments
This image is the copyrighted work of the attributed author or publisher, and
ZFIN has permission only to display this image to its users.
Additional permissions should be obtained from the applicable author or publisher of the image.
Full text @ Dis. Model. Mech.