
- Title
-
Loss of ALS-associated TDP-43 in zebrafish causes muscle degeneration, vascular dysfunction, and reduced motor neuron axon outgrowth
- Authors
- Schmid, B., Hruscha, A., Hogl, S., Banzhaf-Strathmann, J., Strecker, K., van der Zee, J., Teucke, M., Eimer, S., Hegermann, J., Kittelmann, M., Kremmer, E., Cruts, M., Solchenberger, B., Hasenkamp, L., van Bebber, F., Van Broeckhoven, C., Edbauer, D., Lichtenthaler, S.F., and Haass, C.
- Source
- Full text @ Proc. Natl. Acad. Sci. USA
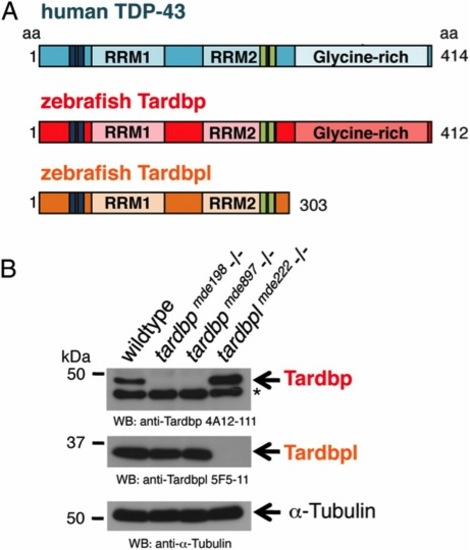
Overview of human TDP-43 and zebrafish orthologs and Western blot of their loss-of-function alleles. (A) Schematic representation of human TDP-43 (turquois), zebrafish Tardbp (red), and zebrafish Tardbpl protein (orange); blue bars represent nuclear localization sequence; green bars represent nuclear export sequence; RRM, RNA recognition motif. (B, Top) Tardbp specific monoclonal antibody 4A12-111 detects the 43-kDa Tardbp protein in adult brain from wild-type and tardbplmde222-/- but not from tardbpmde198-/- and tardbpmde897-/- fish. Asterisk marks an unspecific band. (Middle) Tardbpl-specific monoclonal antibody 5F5-11 detects the approximately 34-kDa Tardbpl protein in adult brain from wild-type, tardbpmde198-/- and tardbpmde897-/- but not from tardbplmde222-/- fish. (Bottom) α-Tubulin serves as a loading control. |
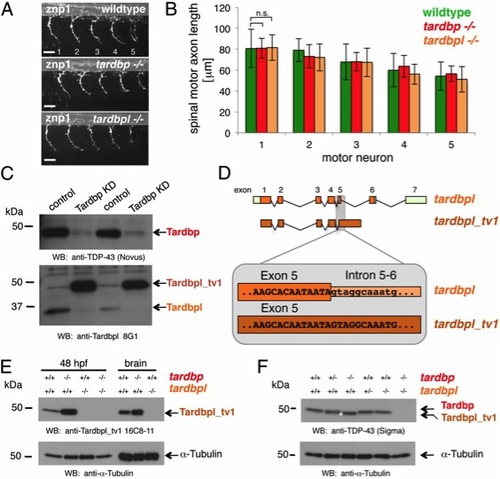
Loss of Tardbp does not affect spinal motor neuron axon outgrowth because of alternative splicing of Tardbpl. (A) Lateral view of wild-type, maternal zygotic tardbp-/-, and maternal zygotic tardbpl-/- embryos at 30 h postfertilization (hpf) showing the five spinal motor neuron axonal projections (labeled 1–5) anterior to the end of the yolk extension stained with znp-1 used for quantitation. Anterior to the left. (Scale bar, 25 μm.) (B) Quantitation of the length of spinal motor neuron axons measured from the exit point of the spinal cord to the growth cone in wild-type (green), maternal zygotic tardbp-/- (red), and maternal zygotic tardbpl-/- embryos (orange). Error bars indicate ±SD, n e 12 embryos per experiment. n.s., not significant, Student t test. (C) Western blot analysis comparing two independent transient Tardbp knockdown experiments with respective control injected wild-type siblings. (Upper) The Western blot with the Tardbp-specific antibody anti–TDP-43 (Novus) reveals a significant reduction of Tardbp (arrow), indicating successful knockdown in lanes 2 and 4. (Lower) Probing with a pool of N-terminal Tardbpl-specific monoclonal antibodies (anti-Tardbpl 8G1) reveals a robust up-regulation of Tardbpl_tv1 upon Tardbp knockdown (lanes 2 and 4). (D) Schematic representation of genomic exon-intron organization of tardbpl (light green boxes represent 5′ and 3′ UTR; orange boxes represents coding exons) and tardbpl_tv1 (only coding exons are shown in dark orange). Enlargement of the exon 5 splice donor site of tardbpl and the corresponding sequence in tardbpl_tv1. (E) Western blot analysis with the Tardbpl_tv1 specific monoclonal antibody Tardbpl_tv1 16C8-11 detects up-regulated Tardbpl_tv1 expression at 48 hpf and in adult brain upon loss of Tardbp compared with wild-type. The anti-Tardbpl_tv1 antibody is specific because no protein is detected in tardbpl-/-. α-Tubulin serves as a loading control. Genotypes are indicated above the respective lanes. (F) Western blot analysis with an anti-human TDP-43 antibody (Sigma) that detects zebrafish Tardbp and Tardbpl_tv1. Genotypes are indicated above the respective lanes. Note that Tardbpl_tv1 is prominently detected in tardbp-/- and runs at a slightly lower molecular weight compared with Tardbp (compare lane 3 with lane 5, labeled with an asterisk). Specificity of the antibody is demonstrated in double homozygous embryos (lane 6). α-Tubulin serves as a loading control. |
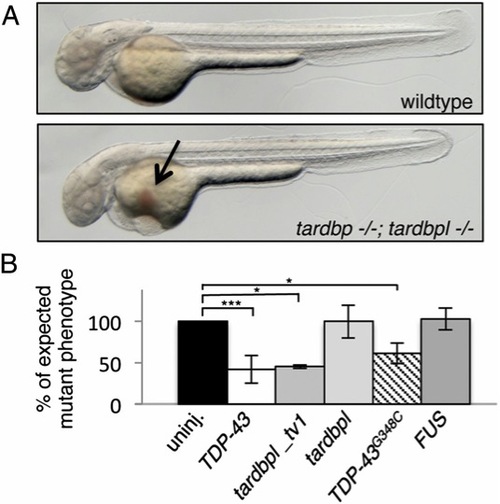
tardbp-/-;tardbpl-/- mutants have impaired blood circulation that can be rescued. (A) tardbp-/-;tardbpl-/- mutants accumulate erythrocytes on the yolk (arrow) because of a lack of circulation at 2 dpf. Anterior to the left. See also Movie S1. (B) The circulation phenotype can be restored by injection of mRNA encoding human TDP-43 and zebrafish Tardbpl_tv1, but not by the shorter isoform Tardbpl. Injection of mRNA of the ALS-associated TDP-43G348C also rescues the circulation phenotype, whereas mRNA of the ALS-associated gene FUS fails to rescue. The black bar represents uninjected double homozygous mutant siblings of each respective clutch. The expected 25% of double-homozygous mutant embryos from incrosses of tardbp-/-;tardbpl+/- or tardbp+/-;tardbpl-/- fish were set to 100%. Error bars indicate ±SD, n e 182 embryos per experiment. *, P < 0.05; ***, P < 0.005, student t test. |
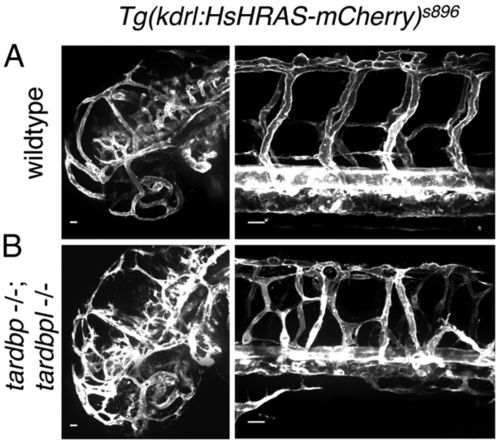
Mispatterned vasculature of tardbp-/-;tardbpl-/- mutants. (A) Whole mount in vivo imaging of wild-type; Tg(kdrl:HsHRAS-mCherry)s896 and (B) tardbp-/-;tardbpl-/-; Tg(kdrl:HsHRAS-mCherry)s896 embryos at 2 dpf. Tg(kdrl:HsHRAS-mCherry)s896 highlights the vasculature. The head is shown on the left and the ISV of the trunk on the right. (Scale bars, 20 μm.) Lateral view, anterior to the left. |
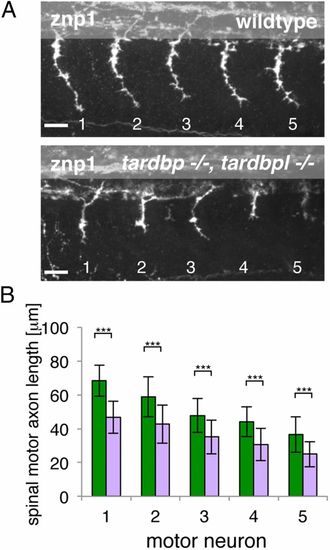
Spinal motor neuron axon outgrowth phenotype of tardbp-/-;tardbpl-/- mutants. (A) Znp-1 antibody staining of motor neuron axons in 28-hpf-old embryos of the five somites (labeled 1–5) anterior to the end of the yolk extension. Spinal motor neuron axons of tardbp-/-;tardbpl-/- mutants are reduced in length compared with wild-type siblings. Anterior to the left, lateral view. (Scale bar, 25 μm.) (B) Quantitation of the length of the outgrowing spinal motor neuron axons measured from the exit point of the spinal cord to the growth cone in wild-type (green) and tardbp-/-;tardbpl-/- mutants (purple). Error bars indicate ±SD, n ≥ 13 embryos per experiment, ***P < 0.0015, Student t test. |

Severely degenerated myocytes of tardbp-/-;tardbpl-/- mutants. (A) Antibody staining of 2-dpf-old wild-type and tardbp-/-;tardbpl-/- mutant embryos with the myosin specific antibody ZE-BO-1F4 (green) and DAPI (blue). White arrowheads indicate degenerated myocytes. (B) Antibody staining of 1.5-dpf-old wild-type and tardbp-/-;tardbpl-/- mutant embryos with α-actinin (green), vinculin (red), and DAPI (blue). (A and B) Anterior to the left, lateral view. (Scale bars, 20 μm.) (C) EM pictures of skeletal muscle of a tardbp-/-;tardbpl-/- mutant embryo shows a highly disorganized pattern of thinner myofibrils (f) with disorganized network of sarcoplasmic reticulum (open arrowheads). Large part of the sarcoplasmic reticulum is misaligned and dilated (filled arrowheads). Individual myofibrils are not well separated from another and mitochondria can now be found within the muscle fibers at (black arrow). (2 dpf) (Scale bars, 500 nm.) |
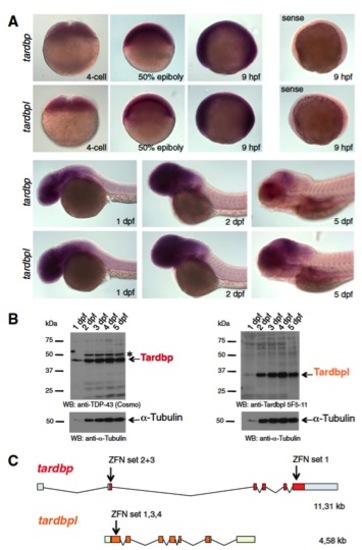
Tardbp and Tardbpl are expressed throughout development and overview of zinc finger binding sites of the ZFN. (A) In situ hybridization with antisense probes specific for tardbp and tardbpl during early developmental stages of 4 cell to 5-dpf-old wild-type embryos. Labeling of 9-hpf-old embryos with a sense probe serves as a negative control (magnification: 10×). (B, Left) Western blot analysis with the Tardbp-specific antibody antiTDP-43 (Cosmo) reveals expression of Tardbp protein 1 dpf through 5 dpf. The asterisk marks an unspecific band. (Right) Western blot analysis with a Tardbpl-specific antibody (anti-Tardbpl 5F5-11) shows that Tardbpl is expressed 1 dpf through 5 dpf. Analysis with an anti–α-Tubulin specific antibody of the respective blots serves as a loading control. (C) Schematic representation of the genomic organization of tardbp (light blue boxes represent 5′ and 3′ UTR; red boxes represent coding exons) and tardbpl (light green boxes represent 5′ and 3′ UTR; orange boxes represent coding exons) locus. Arrows indicate genomic localization of the target sequence of respective ZFN sets. |
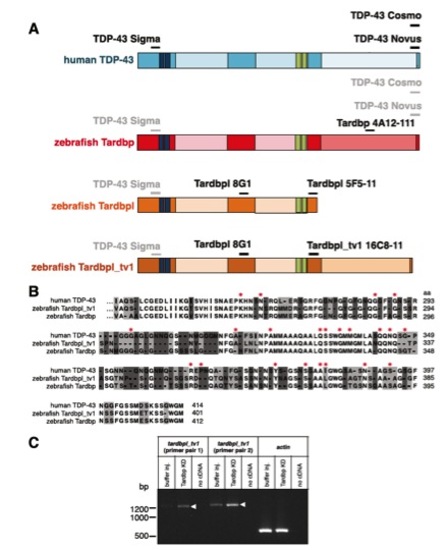
Schematic representation of antibody binding sites, alignment of C termini of human TDP-43, Tarbpl_tv1, and Tardbp, and up-regulation of tardbpl_tv1 mRNA upon loss of Tardbp. (A) Epitopes of respective antibodies (written in black) are indicated as a black line above the schematically represented proteins (protein domains as in Fig. 1). Lines and antibody names in gray indicate cross-reactivity of antibodies raised against human TDP-43 protein with the corresponding epitopes of zebrafish homologs. (B) Amino acid alignment of exon 5 of Tardbpl_tv1 with the corresponding sequence of zebrafish Tardbp and human TDP-43 (identical amino acids are not highlighted, identical amino acids in two of the three amino acids are highlighted in light gray and nonidentical amino acids are highlighted in dark gray). Amino acids mutated in ALS/FTLD patients are marked with a red asterisk. (C) Semiquantitative RT-PCR with primers specific for tardbpl_tv1 (tardbpl_tv1 primer pair 1 and 2) and actin as a loading control. Each primer pair is used on cDNA generated from buffer injected control embryos, Tardbp knockdown embryos, or a negative control with no cDNA added, respectively. Arrowheads indicate the up-regulation of tardbpl_tv1 transcript upon Tardbp KD compared with buffer injected control embryos. |
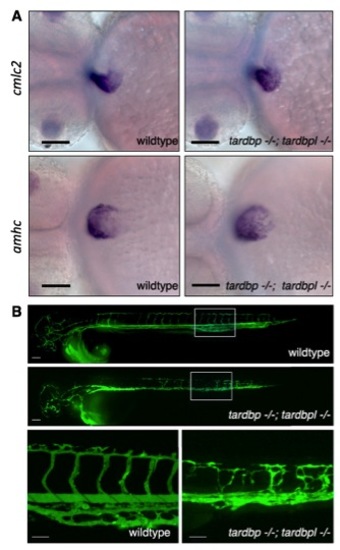
In situ hybridization of cardiac markers and microangiography in tardbp-/-;tardbpl-/- mutants. (A) cmlc2 primarily stains the ventricle whereas amhc. primarily stains the atrial myocardium. These markers do not reveal any obvious differences in wild-type and tardbp-/-;tardbpl-/- embryos. (Scale bars, 100 μm.) Ventral view, anterior to the left, 2 dpf. (B) Green fluorescently labeled beads were microinjected into the lumen of the blood vessels (microangiography) to visualize the lumen of the vasculature. (Top) A wild-type embryo; (Middle) a tardbp-/-;tardbpl-/- mutant. (Scale bar, 100 μm.) (Bottom) Higher magnifications of the area in the white box of the upper panels. (Scale bars, 50 μm.) Lateral view, anterior to the left, 2 dpf. |
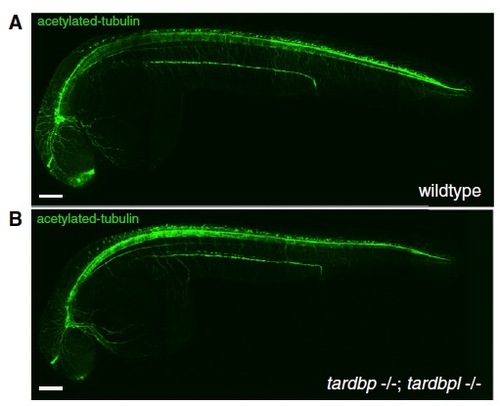
General neuronal outgrowth is not affected in tardbp-/-;tardbpl-/- mutants. (A) Acetylated Tubulin staining demonstrates normal overall axonal patterning in wild-type and (B) tardbp-/-;tardbpl-/- embryos at 2 dpf. Lateral view, Anterior to the left. Images are composites of four images, each aligned by Axiovison (Zeiss) software. (Scale bars, 100 μm.) |
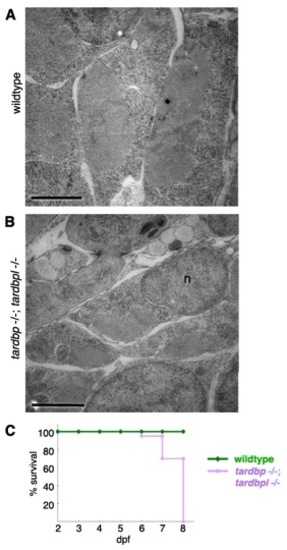
Ultrastructural morphology of myocytes in tardbp-/-;tardbpl-/- mutants analyzed by EM and early lethality. (A) Skeletal muscles of a wild-type embryo display an ordered array of myofibrils surrounded by a highly ordered network of sarcoplasmic reticulum (here shown in cross-sections). Each of the myofibrils is clearly separated by a string of sarcoplasmic reticulum. (B) Skeletal muscle of a tardbp-/-;tardbpl-/- mutant embryo shows a highly disorganized pattern of thinner myofibrils with disorganized network of sarcoplasmic reticulum at 2 dpf.. (Scale bars, 2 μm.) n = nucleus. (C) Kaplan–Meier plot of wild-type (green) and tardbp-/-;tardbpl-/- mutant (purple) embryos. All tardbp-/-;tardbpl-/- mutant embryos analyzed were dead by 8 dpf (n = 20), whereas all wildtype embryos were alive (n = 20). |
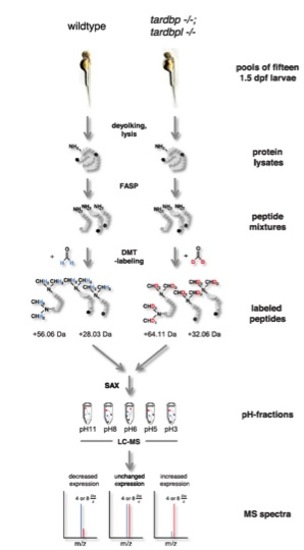
Schematic view of the quantitative proteomic analysis. Pools of 16 1.5-dpf embryos were deyolked and lysed consecutively. Protein lysates were tryptically digested using the filter-assisted sample preparation technique (FASP). Tryptic peptides ending either on arginine (depicted in black) or a lysine (depicted in dark gray) were labeled using differential stable isotope dimethyl labeling (DMT-labeling). Peptides gained from wild-type embryos were labeled “light” using undeuterated formaldehyde, whereas peptides gained from tardbp-/-;tardbpl-/- mutant embryos were labeled “heavy” using deuterated formaldehyde. Dimethylation occurs at free amine-groups resulting in the addition of four methyl-groups to lysine-containing tryptic peptides whereas only two methyl-groups are added to arginine-containing tryptic peptides; this results in a shift of +56.06 Da or +28.03 Da, respectively, for the light-labeledpeptides. Heavy-labeled peptides are shifted by further +8 Da or +4 Da, respectively, because of the two deuterium atoms contained in every methyl-group. After labeling, peptides from both experimental groups were combined and fractionated using stage-tip-based anion-exchange chromatography (SAX). Mass spectrometry was done for every of the five pH-fractions in two technical replicates. Abundance levels of peptides can be calculated from the intensity ratio between the isotope clusters resulting from the light and heavy peptides. |
