- Title
-
Casein kinase 1delta activity: a key element in the zebrafish circadian timing system
- Authors
- Smadja Storz, S., Tovin, A., Mracek, P., Alon, S., Foulkes, N.S., and Gothilf, Y.
- Source
- Full text @ PLoS One

CK1δ inhibition disrupts clock-controlled rhythmic locomotor activity in zebrafish larvae. Locomotor activity of zebrafish larvae was detected by the DanioVision observation chamber. The PF-670462 inhibitor was added to the water at 5 dpf at different concentrations, A-0.5 μM, B-1 μM and C-5 μM (red lines). Control larvae were treated with DMSO at the same concentrations (black lines). The larvae were kept under constant conditions (dim light) and the distance moved (cm, y-axis) was recorded over time (hours, x-axis). The horizontal bars represent the light conditions before and during the experiment. White boxes represent light, black boxes represent dark and grey boxes represent dim light. The rhythm of locomotor activity was completely abolished by the CK1δ inhibitor. PHENOTYPE:
|

CK1ε inhibition does not affect clock-controlled rhythmic locomotor activity in zebrafish larvae. Locomotor activity of zebrafish larvae was detected by the DanioVision observation chamber. Distance moved (cm) is plotted on the y-axis and time (hours) on the x-axis. The horizontal bars represent the lighting conditions before and during the experiment. White boxes represent light, black boxes represent dark and grey boxes represent dim light. The PF-480567 inhibitor was added to the water at two different concentrations, A-5 μM and B-10 μM (blue lines). Control larvae were treated with DMSO at the same concentrations (black lines). CK1ε inhibition did not affect the locomotor activity rhythm, but did have a slight phase shifting effect. PHENOTYPE:
|
|
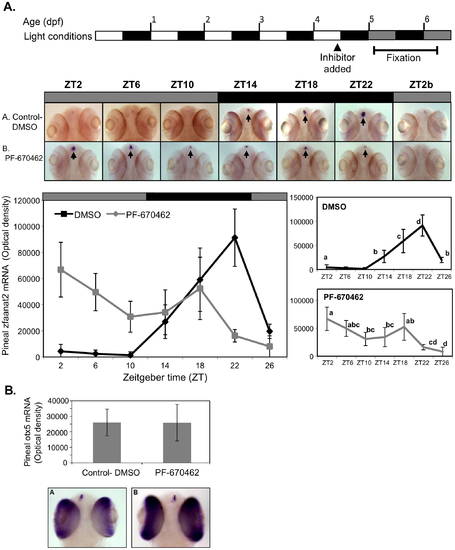
CK1δ inhibition abolishes rhythmic pineal aanat2 mRNA expression. A. Top panel: Schematic representation of the experimental design. The horizontal bars represent the light conditions before and during sampling; white boxes represent light, grey boxes represent subjective day and black boxes represent dark. Middle panel: Whole-mount ISH signals for aanat2 mRNA (dorsal views of the heads) of representative specimens treated with DMSO (control, a) or with PF-670462 (5 μM) (a). Zeitgeber times (ZT) are indicated for each sample. ZT0 corresponds to “lights-on,” ZT12 to “lights-off”. ZT2b refers to the second day of the experiment. ISH signals in the pineal gland are indicated by arrows. Bottom chart: Quantification of signal intensities in the pineal glands of control (DMSO) larvae (black line) and PF-670462-treated larvae (grey line). Values represent the mean ± SE optical densities of the pineal signals. Aanat2 mRNA expression is significantly affected by treatment and sampling times (P<0.01 by two way ANOVA). Differences in sampling time within each treatment were determined by one-way ANOVA followed by Tukey′s post-hoc test for each treatment. B. Whole-mount ISH signals for otx5 mRNA at ZT2. Photographs of pineal signals in (a) DMSO (control) and (b) CK1δ-treated larvae are presented in the bottom panel. |
|
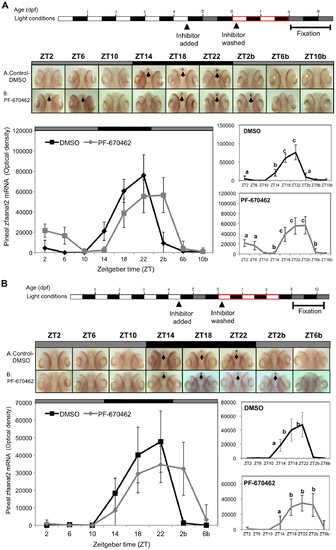
The effect of CK1δ inhibition on rhythmic pineal aanat2 mRNA expression is reversible. Reversibility was determined after two (A) or three (B) LD cycles for re-entrainment. Top panels: Experimental design. The horizontal bars represent the light conditions before and during sampling; white boxes represent light, grey boxes represent subjective day and black boxes represent dark. Middle panels: Whole-mount ISH signals (dorsal views of the heads) of representative specimens treated with DMSO (control, a) or with PF-670462 (b). ZT 2-10b refers to the second 24 h cycle of the sampling. Bottom panels: Signal intensities in the pineal gland. Values represent the mean ± SE optical density of the pineal signals. Statistical analysis was performed using one-way ANOVA followed by Tukey′s post-hoc test for each treatment. Following removal of the inhibitor and re-entrainment, for two (A) or three (B) LD cycles, the rhythm of aanat2 mRNA re-appeared but seemed to be shifted. |
|
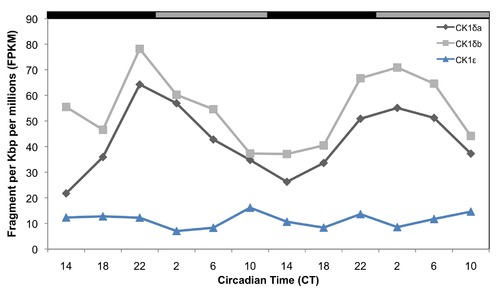
Temporal expression patterns of mRNAs encoding CK1 enzymes in the zebrafish pineal gland, determined by RNA-seq analysis. CK1δa and CK1δb mRNAs expression patterns are shown in black and grey lines, respectively, and CK1ε is shown in blue. CT = circadian time. Gray and black bars represent subjective day and subjective night, respectively. |


