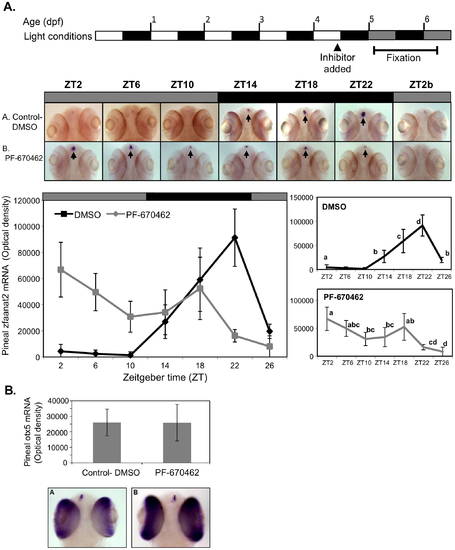
CK1δ inhibition abolishes rhythmic pineal aanat2 mRNA expression. A. Top panel: Schematic representation of the experimental design. The horizontal bars represent the light conditions before and during sampling; white boxes represent light, grey boxes represent subjective day and black boxes represent dark. Middle panel: Whole-mount ISH signals for aanat2 mRNA (dorsal views of the heads) of representative specimens treated with DMSO (control, a) or with PF-670462 (5 μM) (a). Zeitgeber times (ZT) are indicated for each sample. ZT0 corresponds to “lights-on,” ZT12 to “lights-off”. ZT2b refers to the second day of the experiment. ISH signals in the pineal gland are indicated by arrows. Bottom chart: Quantification of signal intensities in the pineal glands of control (DMSO) larvae (black line) and PF-670462-treated larvae (grey line). Values represent the mean ± SE optical densities of the pineal signals. Aanat2 mRNA expression is significantly affected by treatment and sampling times (P<0.01 by two way ANOVA). Differences in sampling time within each treatment were determined by one-way ANOVA followed by Tukey′s post-hoc test for each treatment. B. Whole-mount ISH signals for otx5 mRNA at ZT2. Photographs of pineal signals in (a) DMSO (control) and (b) CK1δ-treated larvae are presented in the bottom panel.
|
