
Image
|
Figure Caption
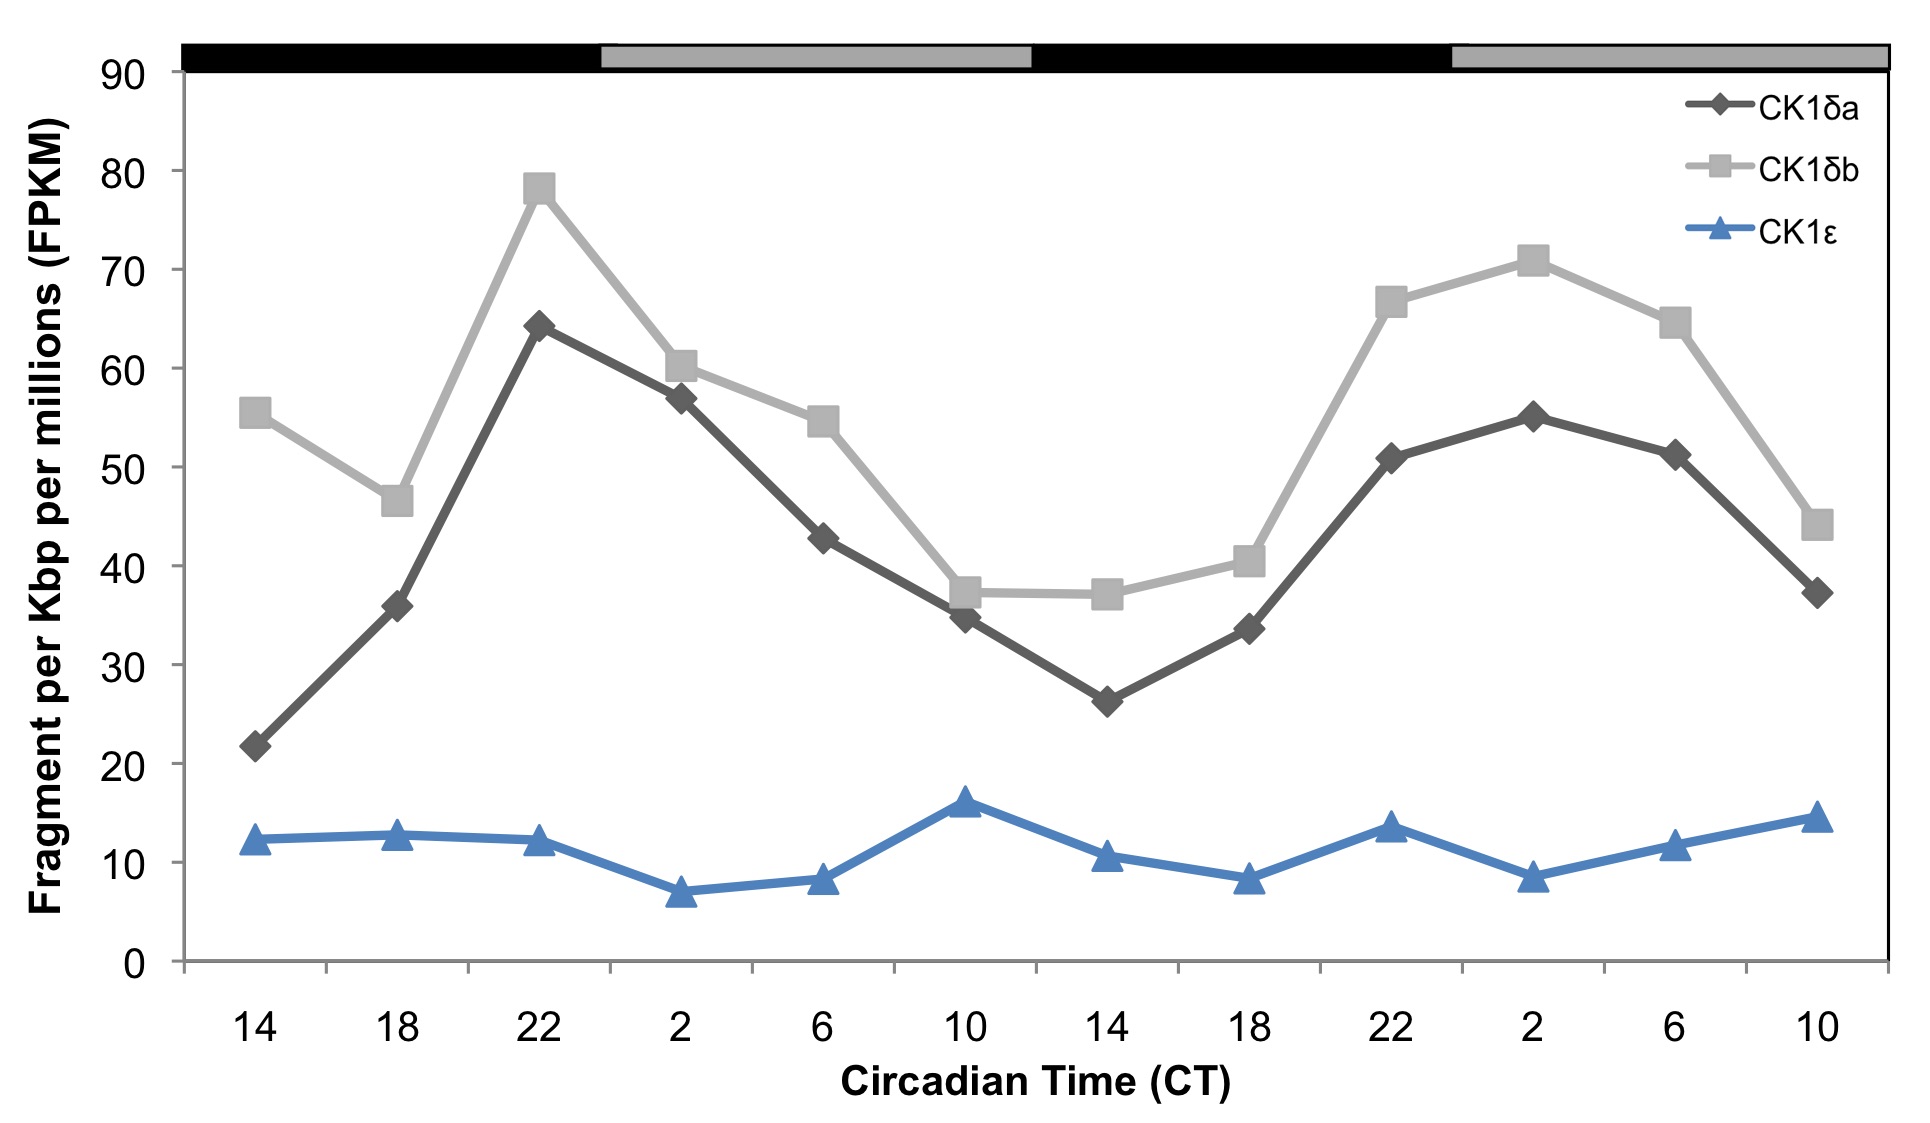
Fig. S3 Temporal expression patterns of mRNAs encoding CK1 enzymes in the zebrafish pineal gland, determined by RNA-seq analysis. CK1δa and CK1δb mRNAs expression patterns are shown in black and grey lines, respectively, and CK1ε is shown in blue. CT = circadian time. Gray and black bars represent subjective day and subjective night, respectively.
Figure Data
Acknowledgments
This image is the copyrighted work of the attributed author or publisher, and
ZFIN has permission only to display this image to its users.
Additional permissions should be obtained from the applicable author or publisher of the image.
Full text @ PLoS One