
- Title
-
Systematic Identification of Rhythmic Genes Reveals camk1gb as a New Element in the Circadian Clockwork
- Authors
- Tovin, A., Alon, S., Ben-Moshe, Z., Mracek, P., Vatine, G., Foulkes, N.S., Jacob-Hirsch, J., Rechavi, G., Toyama, R., Coon, S.L., Klein, D.C., Eisenberg, E., and Gothilf, Y.
- Source
- Full text @ PLoS Genet.
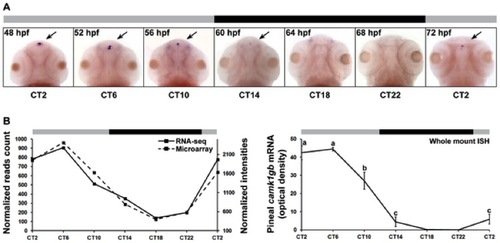
camk1gb spatio-temporal expression. A) Rhythmic expression of camk1gb exclusively in the pineal glands (indicated by black arrows) of 48–72 hpf embryos as detected by whole mount ISH under constant darkness. B) Rhythmic expression of camk1gb in the zebrafish embryo (right) is correlated with the RNA-seq (solid line, left vertical axis) and the microarray data (dashed line, right vertical axis) from the adult (left). Correlation coefficients between the whole mount ISH results and the data obtained by microarrays and RNA-seq were determined by Pearson correlation (r = 0.89 and 0.77, respectively). For whole mount ISH, statistical differences in mRNA levels were determined by one-way ANOVA followed by a Tukey test (P-value<0.05). Error bars represent SE (n = 10–15). CT = circadian time. Gray and black bars represent subjective day and subjective night, respectively. EXPRESSION / LABELING:
|

The effect of camk1gb knockdown on larval locomotor activity rhythms. A) Average locomotor activity of 6–8 dpf larvae injected with either control morpholino (black trendline), camk1gb morpholino (gray trendline) or co-injected camk1gb morpholino together with camk1gb mRNA (green trendline), under constant dim-light. Activity was measured as the average distance moved for time units of 10 min and smoothed using moving average. Error bars represent SE (n = 16). Black and gray horizontal boxes represent subjective night and day, respectively. B) Cumulative distribution of g-factor values for each group. Significant differences in the g-factor distribution were revealed between the control morpholino and camk1gb morpholino treated groups as well as between the rescue and camk1gb morpholino injected groups (Kolmogorov-Smirnov test, P-value<0.05 and <0.01, respectively). C) Representative activity profiles of control morpholino (black curve) and camk1gb morpholino (gray curve) injected larvae which correspond to the median g-factor of each group. The median g-factor values are marked by red circles in (D). D) Significant differences in the cumulative distribution of g-factor values between control morpholino (black curve) and camk1gb morpholino (gray curve) injected groups (n = 75), generated from the analysis of four similar experiments (Kolmogorov-Smirnov test, P-value<10-5). |
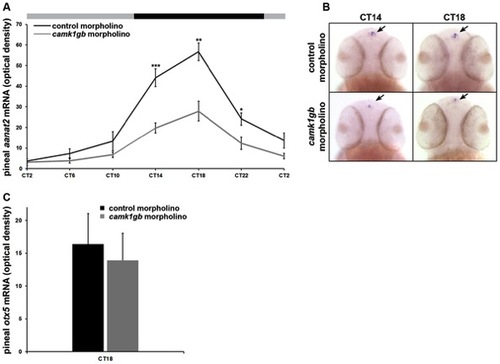
Effect of camk1gb knockdown on pineal aanat2 and otx5 mRNA rhythms.Zebrafish embryos injected with either control morpholino (black line) or camk1gb morpholino (gray line) were subjected to DD during their third day of development and pineal aanat2 and otx5 mRNA levels were determined by whole mount ISH. A) Embryos were sampled at 4-hr intervals for aanat2. Statistical differences in aanat2 mRNA levels between the control morpholino and camk1gb morpholino injected embryos were determined by two-tailed t-test with Bonferroni correction (* P-value<0.05, ** P-value<0.01, *** P-value<0.001). B) Whole-mount ISH for aanat2 in the heads (dorsal views) of representative larvae from each group, at CT14 and CT18. Arrows indicate pineal aanat2 mRNA expression. C) otx5 expression at CT18. Error bars represent SE (n = 10–15). CT = circadian time. EXPRESSION / LABELING:
PHENOTYPE:
|
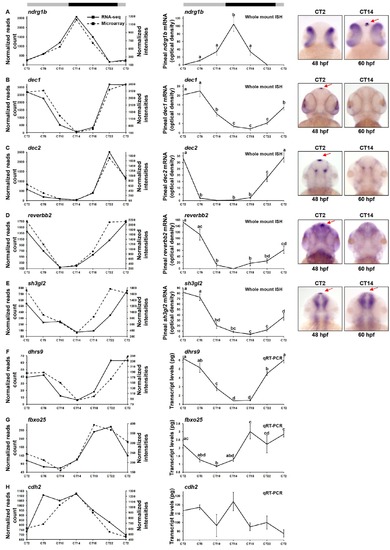
Whole-mount ISH and qRT-PCR validations. The circadian expression of several genes was validated using whole mount ISH on embryos at the age of 48–72 hours (A–E, right curves) and qRT-PCR on adult pineal glands (F–H, right curves). Left curves represent the circadian profile of each gene as obtained by RNA-seq (solid line, left vertical bar) and DNA-microarray (dashed line, right vertical bar). Representative pictures of embryos heads (dorsal view), subjected to whole mount ISH for ndrg1b, dec1, dec2, reverbb2 and sh3gl2 at CT2 and CT14, are presented at the rightmost side of A–E. The pineal gland is indicated by a red arrow. Different letters represent statistical differences in mRNA levels as determined by one-way ANOVA followed by a Tukey test (P-value<0.05). Note that cdh2 was not validated as circadian (H). Error bars represent SE (n = 10–15). CT = circadian time. Gray and black bars represent subjective day and subjective night, respectively. Whole mount ISH validation of camk1gb is given in Figure 3. |
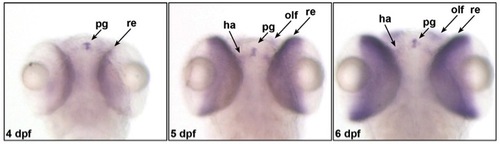
camk1gb expression at later larval stages. camk1gb expression on days 4–6 post fertilization is enhanced in the pineal gland (pg) and expends to the retina (re), habenula (ha) and olfactory bulbs (olf) as detected by whole mount ISH. |
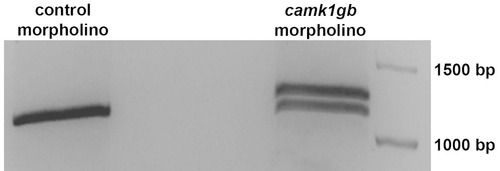
PCR analysis of camk1gb following camk1gb morpholino injection. camk1gb morpholino injection changed the normal splicing of camk1gb mRNA, leading to an insertion of intron5 (right lane) which adds a premature stop codon. Injection of control morpholino had no effect on camk1gb splicing (left lane). |
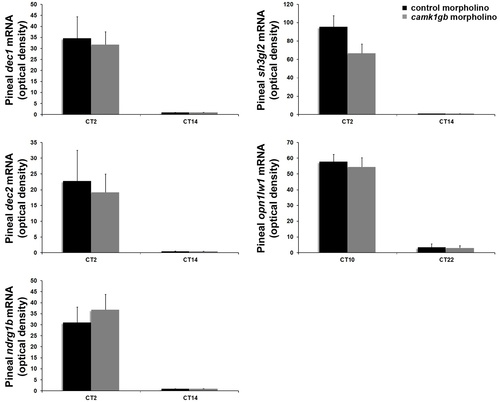
Effect of camk1gb knockdown on the expression of known clock-controlled genes. Zebrafish embryos injected with either control morpholino (black bar) or camk1gb morpholino (gray bar) were subjected to DD during their third day of development and sampled at the peak and the nadir of their rhythm. Pineal mRNA levels of dec1, dec2, ndrg1l, sh3gl2 and opn1lw1 were determined by whole mount ISH. No statistically significant differences were observed (two-tailed t-test). Error bars represent SE (n = 10–15); CT = circadian time. |
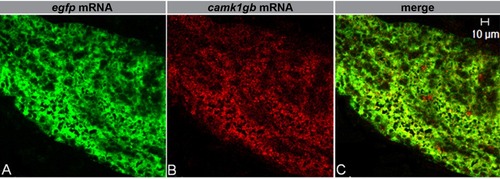
camk1gb expression in the adult pineal gland of transgenic zebrafish, Tg(aanat2:EGFP)Y8. Double fluorescent in situ hybridization for egfp mRNA (A, green) and camk1gb mRNA (B, red) in adult pineal glands, reveals co-expression of camk1gb and the aanat2:EGFP transgene (C, merged image). Scale bar = 10 μm. |