
|
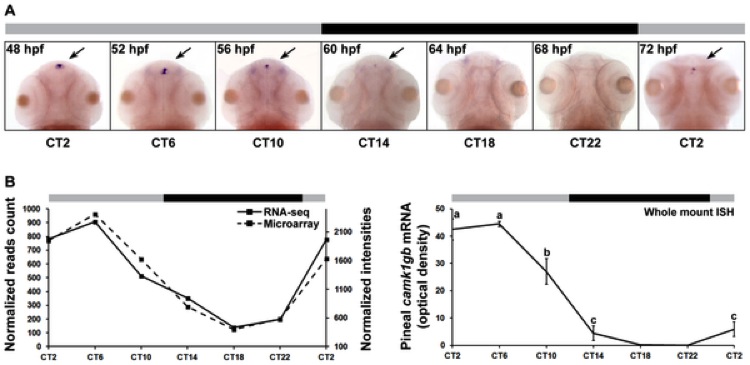
Fig. 3 camk1gb spatio-temporal expression. A) Rhythmic expression of camk1gb exclusively in the pineal glands (indicated by black arrows) of 48–72 hpf embryos as detected by whole mount ISH under constant darkness. B) Rhythmic expression of camk1gb in the zebrafish embryo (right) is correlated with the RNA-seq (solid line, left vertical axis) and the microarray data (dashed line, right vertical axis) from the adult (left). Correlation coefficients between the whole mount ISH results and the data obtained by microarrays and RNA-seq were determined by Pearson correlation (r = 0.89 and 0.77, respectively). For whole mount ISH, statistical differences in mRNA levels were determined by one-way ANOVA followed by a Tukey test (P-value<0.05). Error bars represent SE (n = 10–15). CT = circadian time. Gray and black bars represent subjective day and subjective night, respectively.