- Title
-
Dynamic microtubules at the vegetal cortex predict the embryonic axis in zebrafish
- Authors
- Tran, L.D., Hino, H., Quach, H., Lim, S., Shindo, A., Mimori-Kiyosue, Y., Mione, M., Ueno, N., Winkler, C., Hibi, M., and Sampath, K.
- Source
- Full text @ Development
|
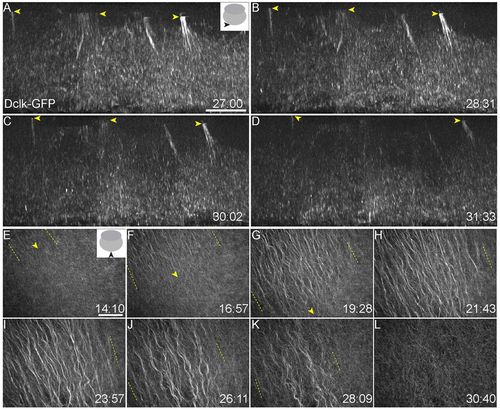
Microtubule populations at the vegetal cortex of zebrafish embryos. (A-D) Tg(ef1α:dclk-GFP) expression shows perpendicular bundles at a depth of ∼15-30 μm inside the vegetal cortex, oriented along the animal-vegetal axis of the embryo. Yellow arrowheads indicate the position of perpendicular bundles moving through the yolk. (E-L) Parallel arrays form from ∼14 mpf, grow directionally and extend to cover a large area of the vegetal cortex before dissociating from 26 mpf. Parallel arrays are replaced by a non-directional meshwork (L) by ∼30 mpf. Yellow arrowheads (E-G) mark the front and yellow dashed lines (E-K) indicate the spread of parallel arrays. Insets in A and E show schematic of views, and viewing orientation is shown with solid black arrowheads. Numbers at bottom right of panels indicate mpf. Scale bars: in A, 10 μm; in E, 40 μm. EXPRESSION / LABELING:
|
|
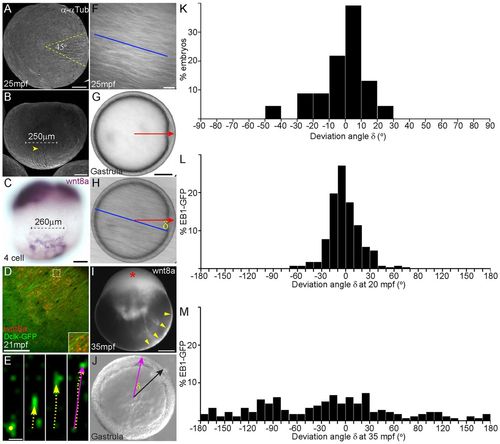
Parallel microtubule arrays are directed towards embryonic dorsal. (A,B) Immunostaining to detect α-Tubulin shows that parallel arrays form asymmetrically at one side of the vegetal cortex and cover a sector of ∼45°. Yellow dashed lines in A mark the extent of spread; yellow arrowhead in B marks one end of parallel arrays. (C) Parallel arrays are spread over ∼250 μm, similar to the spread of wnt8a transcripts at early cleavage stages. (D) Colocalization of parallel arrays (Dclk2-GFP in green) and fluorescent injected Alexa568 UTP-labeled wnt8a RNA (red punctae) at ∼20 mpf is shown. Inset shows higher magnification of area marked with white dotted square. (E-M) Injected fluorescent wnt8a RNA localizes asymmetrically to the vegetal lateral cortex (yellow arrowheads in I) and to the blastoderm (red asterisk in I), similar to endogenous wnt8a transcripts. (F-M) Orientation of parallel arrays at 20-30 mpf (F), compared with position of the dorsal organizer (shield, red arrow in G,H) at gastrulation (G), and the difference between orientation of parallel arrays and the position of the shield was used to calculate the deviation angle (δ) (H). More than 90% of embryos formed the shield within 30° of the parallel arrays (K) (n=23 embryos). EB1-GFP comets were tracked at 4-second intervals (E), starting at 20 mpf (L) or 35 mpf (M). Direction of movement of each comet was calculated and is presented as a purple arrow (E,J). 50 comets were tracked at 20 mpf and 30 comets at 35 mpf, n=6 embryos. The position of the shield was identified during gastrulation (black arrow in J), and the angle of deviation (δ) was calculated. Graph in L shows that most comets moved towards the future dorsal organizer at 20 mpf, whereas at 35 mpf (graph in M), comets at the same location moved randomly. A,D-H,J vegetal views; B,C,I, lateral views. Scale bars: in A-C,G,I, 100 μm; in D, 50 μm; in E, 1 μm; in F, 10 μm. |
|
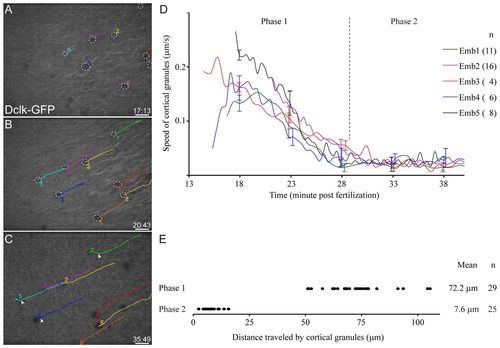
Cortical granules at the vegetal pole are displaced by 20°. (A-D) Cortical granules (dotted white circles in A,B) at the vegetal pole move fast and in the same direction as parallel arrays before 30 mpf (Phase 1; B,D), and move slowly and randomly after parallel arrays disappear (Phase 2; C,D). Colored lines in B and C indicate individual cortical granules that were numbered and tracked. White arrowheads in C mark the position where cortical granules are no longer directional and begin moving randomly. (D) Each line shows the average speed of cortical granules in each embryo (number of granules tracked for each embryo shown in parentheses). Error bars are shown for selected time points and represent s.d. (E) Graph shows the distance traveled by individual cortical granules, and this measurement was used to calculate the angle of displacement. The cortical granules are displaced by ∼20°. Scale bars: 20 μm. |
|
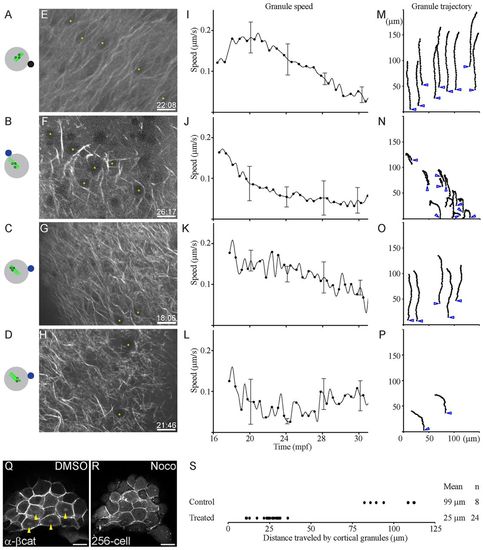
Directional movement of vegetal cortical granules is dependent on parallel microtubule arrays. (A-D) Schematics showing position of beads relative to the arrays. DMSO bead is shown as a solid black circle (A); nocodazole beads are shown as solid blue circles (B-D); parallel arrays are shown as solid green lines (A-D), nocodazole-disrupted arrays as dashed green lines (B-D), and granules are depicted as open black circles (A-D). (E-H) Dclk2-GFP-labeled arrays show extent of disruption of microtubules in bead-treated embryos (time of image in mpf at bottom right of each panel; yellow asterisks indicate granules tracked). (I-L) Granules in embryos treated with DMSO control beads and granules at a distance from nocodazole-soaked beads travel faster (A,C,I,K), than granules adjacent to nocodazole beads (B,D,J,L), which do not show much movement. Graphs in K,L are from granules at different locations in the same embryo. (M-P) Tracking the trajectory of the granules shows that DMSO control beads do not affect directed granule movement (M), similar to granules at a distance from nocodazole-soaked beads (O). By contrast, granules near nocodazole-soaked beads show random movement, and sudden changes in the direction of movement (N,P). Trajectory of individual granules is shown as hatched black lines; blue open arrowheads show initial granule position. (Q,R) Absence of nuclear β-Catenin accumulation in dorsal cells (R) indicates the effect of transient and local nocodazole treatment on dorsal specification in comparison to control DMSO treatment (Q; yellow arrowheads indicate β-Catenin-positive nuclei). (S) Distance traveled by individual cortical granules in control bead or nocodazole bead-treated embryos. Scale bars: in E-H, 15 μm; in Q,R, 50 μm. |
|
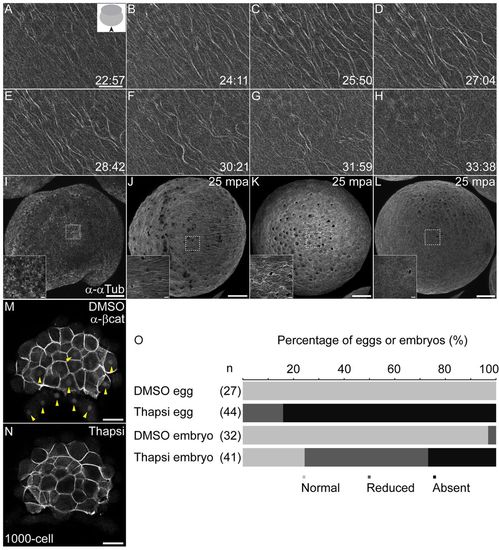
Formation of parallel arrays is independent of fertilization but dependent on calcium signaling. (A-H) Parallel arrays form in unfertilized, activated eggs, and show similar dynamics to arrays in fertilized embryos. Inset in A shows schematic of view, and viewing direction is shown with a solid black arrowhead. (I-L) Parallel arrays are not detected in unactivated eggs (I), in comparison with normal arrays (J) observed in DMSO-treated and reduced (K) or missing (L) arrays in thapsigargin-treated, unfertilized eggs. Insets in I-L show magnified images of regions marked by white dashed squares. (M,N) Thapsigargin-treated embryos show loss of nuclear β-Catenin (N) in comparison with control DMSO-treated embryos (M, yellow arrowheads indicate β-Catenin-positive nuclei in the yolk syncytial layer and blastoderm). (O) Percentage of eggs or embryos with absent (black), reduced (dark gray) or normal (pale gray) parallel arrays from DMSO or thapsigargin-treatments. Number of eggs/embryos are indicted in parentheses. Scale bars: in A, 20 μm; in I-L, 100 μm; in I-L insets, 10 μm; in M,N, 50 μm. |
|
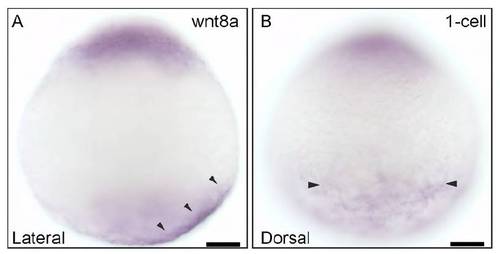
Expression of maternal wnt8a in 1-cell stage embryos. (A) Lateral view showing asymmetric localization of wnt8a RNA on the vegetal cortex (arrowheads). (B) Dorsal view showing the extent of wnt8a RNA distribution on the yolk cortex (arrowheads), along the animal-vegetal axis. Scale bars: 50 μm. |
|
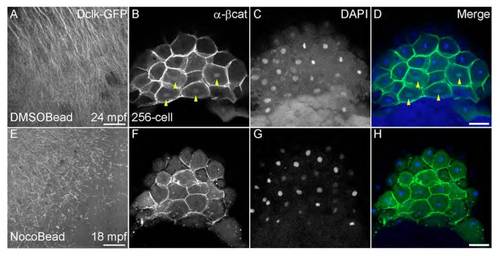
Transient and local disruption of parallel microtubule arrays affects dorsal specification. (A,E) Dcklk-GFP labeled arrays shows local disruption in nocodazole bead-treated embryos (E) in comparison with control DMSO bead-treated embryos (A). (B,F) Nuclear accumulation of β-Catenin in DMSO bead-treated embryos (yellow arrowheads in B), in comparison with absence of β-Catenin in nocodazole bead-treated embryos (F). (C,D,G,H) DAPI staining (C,G) shows all nuclei in control and nocodazole-treated embryos, and D,H show merged images for β-Catenin and DAPI staining. Scale bars: in A,E, 30 μm; in D,H, 50 μm. |
|
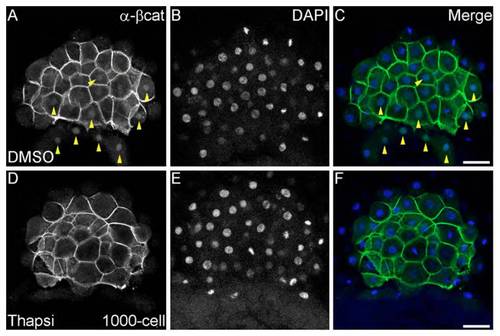
Disruption of Ca2+ signaling affects dorsal specification. (A,D) Dorsal nuclear accumulation β-Catenin in DMSO-treated embryos (yellow arrowheads in A) in comparison with absence of β-Catenin in thapsigargin-treated embryos (D). (B,C,E,F) DAPI staining (B,E) shows all nuclei in control and thapsigargintreated embryos, and C,F show merged images for β-Catenin and DAPI staining. Scale bars: 50 μm. |

ZFIN is incorporating published figure images and captions as part of an ongoing project. Figures from some publications have not yet been curated, or are not available for display because of copyright restrictions. EXPRESSION / LABELING:
|

