
|
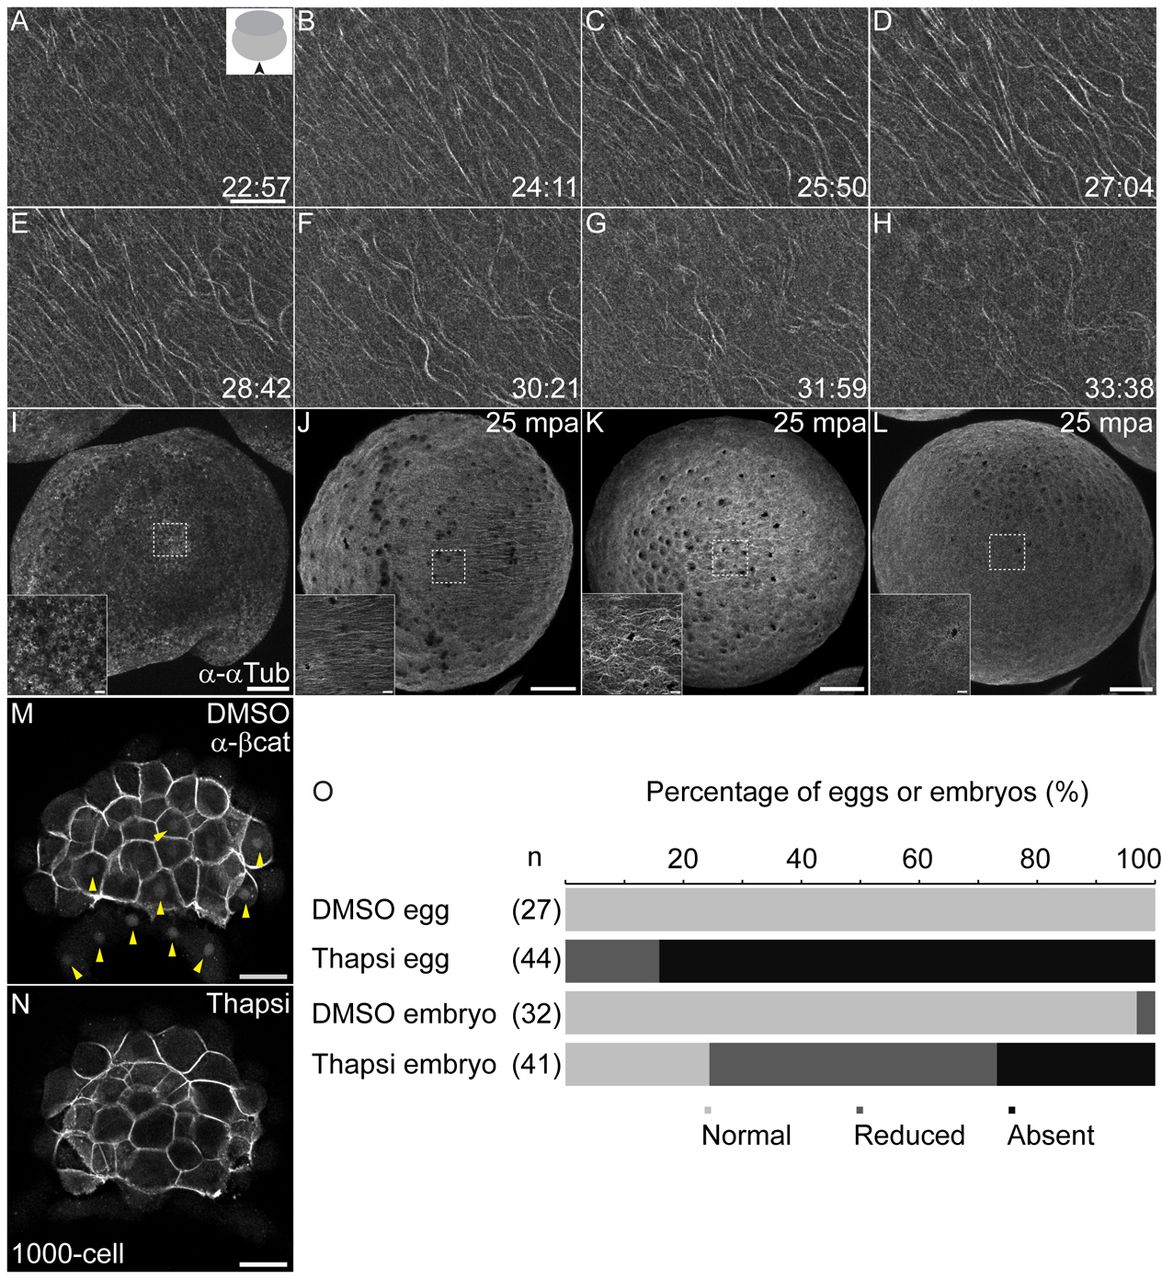
Fig. 5 Formation of parallel arrays is independent of fertilization but dependent on calcium signaling. (A-H) Parallel arrays form in unfertilized, activated eggs, and show similar dynamics to arrays in fertilized embryos. Inset in A shows schematic of view, and viewing direction is shown with a solid black arrowhead. (I-L) Parallel arrays are not detected in unactivated eggs (I), in comparison with normal arrays (J) observed in DMSO-treated and reduced (K) or missing (L) arrays in thapsigargin-treated, unfertilized eggs. Insets in I-L show magnified images of regions marked by white dashed squares. (M,N) Thapsigargin-treated embryos show loss of nuclear β-Catenin (N) in comparison with control DMSO-treated embryos (M, yellow arrowheads indicate β-Catenin-positive nuclei in the yolk syncytial layer and blastoderm). (O) Percentage of eggs or embryos with absent (black), reduced (dark gray) or normal (pale gray) parallel arrays from DMSO or thapsigargin-treatments. Number of eggs/embryos are indicted in parentheses. Scale bars: in A, 20 μm; in I-L, 100 μm; in I-L insets, 10 μm; in M,N, 50 μm.