
- Title
-
Major isoform of zebrafish P0 is a 23.5 kDa myelin glycoprotein expressed in selected white matter tracts of the central nervous system
- Authors
- Bai, Q., Sun, M., Stolz, D.B., and Burton, E.A.
- Source
- Full text @ J. Comp. Neurol.
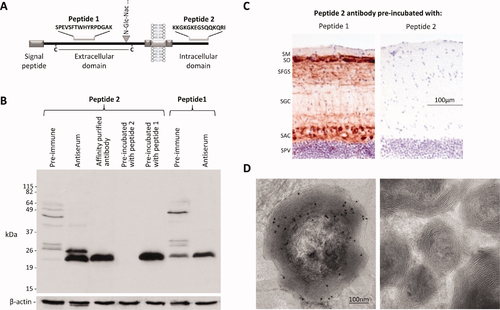
Development of specific antibodies against zebrafish P0. A: The diagram shows the predicted domain organization of zebrafish P0, illustrating key features discussed in the text. The positions and sequences of the two peptides used to raise P0 antibodies are shown. B: Zebrafish whole brain lysate (50 μg protein/lane) was separated by SDS-PAGE and transferred to PVDF membrane. The resulting western blot was divided into strips, allowing each lane to be probed using a different primary antibody: 1) preimmune serum from an animal subsequently immunized with peptide 2; 2) antiserum from the same animal following immunization with peptide 2; 3) affinity-purified antibody against peptide 2 derived from the serum shown in lane 2 (this is referred to as “P0 antibody”in Figs. 2, 3, 4, 5, 6, 7, 2–7); 4) affinity-purified antibody shown in lane 3, preincubated with peptide 2; 5) affinity-purified antibody shown in lane 3, preincubated with peptide 1; 6) preimmune serum from an animal subsequently immunized with peptide 1; 7) antiserum from the same animal following immunization with peptide 1. After incubation with secondary antibody, the strips were reassembled into the original blot, prior to the application of chemiluminescent reagent, in order to allow direct comparison between lanes. The blot was subsequently reprobed with an antibody to β-actin in order to verify equal protein loading in each lane (bottom panel). C: Cryosections encompassing the optic tectum were labeled immunohistochemically using affinity-purified peptide 2 antibody (shown in lane 3 of panel B). The antibody was preincubated with peptide 2, containing its cognate epitope (right panel), or with peptide 1 at the same concentration, as a negative control (left panel). Bound antibody was detected using a histochemical reaction with a red product. A blue nuclear counterstain was used in order to facilitate identification of tectal laminae. The scale bar for both panels is shown in the right panel. D: Transmission electron micrographs of adult zebrafish spinal cord showing myelinated axons in cross-section. The specimen on the left was immunolabeled with affinity-purified peptide 2 antibody (shown in lane 3 of panel B). The secondary antibody was conjugated to 10 nm colloidal gold and the specimen counterstained with uranyl acetate; immunoreactivity appears as small black circles. The panel on the right shows a control sample that was processed identically, except that primary antibody was omitted. EXPRESSION / LABELING:
|
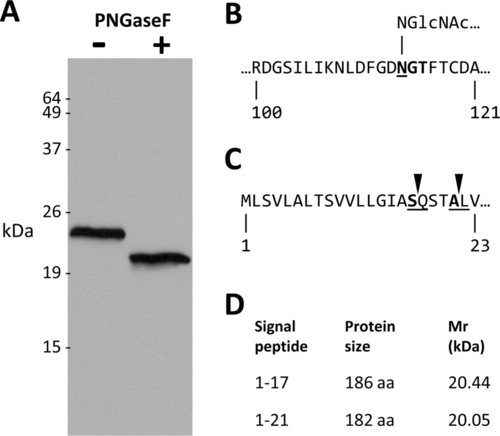
Zebrafish P0 is a 23.5 kDa glycoprotein. A: A western blot probed with P0 antibody. Whole adult zebrafish brain lysate (32 μg protein per lane) was incubated with (+; right lane) or without (+ left lane) PNGaseF, prior to SDS-PAGE and western transfer. B: A short segment of the predicted extracellular domain of P0 is shown is shown (amino acids are numbered with respect to the full open reading frame). The consensus N-glycosylation motif is shown in bold. Underlining denotes the asparagine residue to which the N-acetyl-glucosamine side chain is linked. C: The N terminus of P0 is shown, illustrating the predicted signal peptide cleavage sites. D: The table shows the size and predicted molecular mass of P0 after cleavage of the signal peptide at each of the putative cleavage sites. |
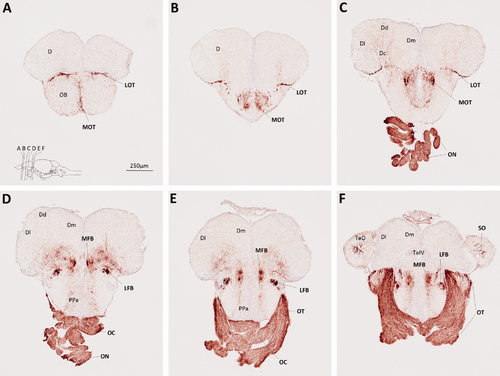
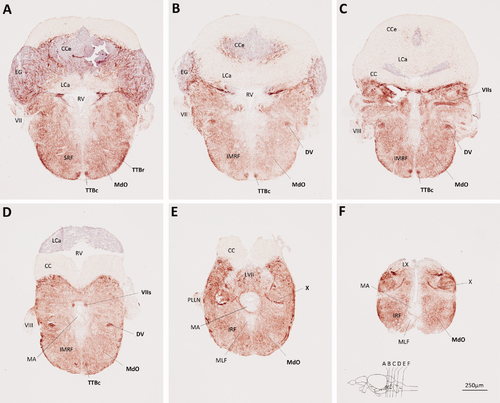
Myelin P0 expression in the telencephalon, optic nerves, and adjacent structures. Transverse sections of adult zebrafish brain, from posterior olfactory bulbs to anterior tectum, were labeled using P0 primary antibody, and a histochemical reaction yielding a red product. A blue nuclear counterstain was used to facilitate identification of anatomical features. The sections, which are oriented dorsal upwards, progress in a rostrocaudal direction; their planes are indicated in the inset to A, which also shows the scale bar for all six panels. Anatomical landmarks are indicated on the left side of each image, and P0-immunoreactive structures are labeled in bold on the right side of each image. For anatomical annotations, please see list of abbreviations. EXPRESSION / LABELING:
|
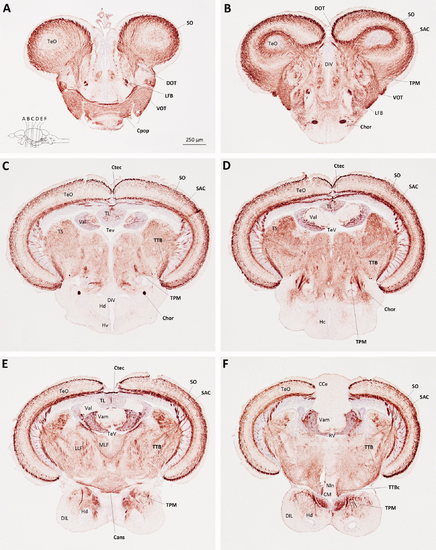
Myelin P0 expression in the optic tectum, hypothalamus, and adjacent structures. Transverse sections of adult zebrafish brain, from the level of the postoptic commissure to the mammillary bodies, were labeled using the same method employed to generate Figure 3. Sections are oriented dorsal upwards and progress in a rostrocaudal direction; their planes are indicated in the inset to A, which also shows the scale bar for all six panels. Anatomical landmarks are indicated on the left side of each image, and P0-immunoreactive structures are labeled in bold on the right side of each image. EXPRESSION / LABELING:
|
Myelin P0 expression in the hindbrain. Transverse sections of adult zebrafish hindbrain were labeled using the same method employed to generate Figure 3. Sections are oriented dorsal upwards and progress in a rostrocaudal direction; their planes are indicated in the inset to F, which also shows the scale bar for all six panels. Anatomical landmarks are indicated on the left side of each image and P0-immunoreactive structures are labeled in bold on the right side of each image. EXPRESSION / LABELING:
|
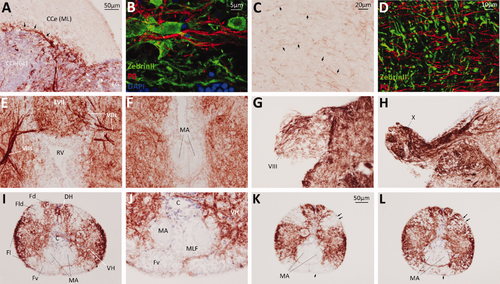
Myelin P0 expression in the hindbrain, cranial nerves, and spinal cord. Transverse sections of adult zebrafish hindbrain and spinal cord were labeled by immunohistochemistry to reveal P0 (A,C,E–L), or by immunofluorescence to detect P0 (red), Zebrin II (green) and nuclei (blue) (B,D). The bar in A shows the scale for A,E–I; the bar in C shows the scale for C,J; the bar in K shows the scale for K,L. A: Body of cerebellum. Black arrows indicate bundles of P0-immunoreactive fibers that appear to arise from the junction between the molecular and granule cell layers. White arrows indicate P0-expressing fibers that pass through the granular eminence. B: A single confocal plane is shown at the junction between the molecular and granule cell layers to illustrate the relationship between P0 immunoreactive fibers (red, red arrows) and Purkinje cells and their axons (green, green arrows). Nuclei of the granule cell layer (blue) are seen at the bottom of the image. C: Body of cerebellum. The neuropil of the molecular layer is shown. Black arrows show examples of the numerous single P0-immunoreactive fibers passing through the molecular layer. D: A single confocal plane of the molecular layer is shown to illustrate the relationship between P0 immunoreactive fibers (red) and Purkinje cell dendrites (green). E: Dorsal medulla. F: Ventral medulla. G: Cranial nerve VIII. H: Cranial nerve X. I–L: Spinal cord. Images K,L show adjacent sections that were labeled identically, except that the section shown in panel L was pretreated to remove myelin lipids before processing for immunohistochemistry. The black arrows show the regions in Fld and Fv that show enhanced P0 immunoreactivity following lipid solubilization. EXPRESSION / LABELING:
|

Developmental expression of P0. Sections of zebrafish larvae were labeled using the same method employed to generate Figure 3, illustrating developmental P0 expression in the hindbrain (A–E), the spinal cord (F–J), the visual pathways (K–N), the mesencephalon (O), and the telencephalon (P). The scale bar for images A–D,G,K–M is shown in A; the scale bar for images E,O is shown in panel E; the scale bar for images F,H,I,N is shown in panel F; the scale bar for images J,P is shown in panel J. Horizontal sections of the ventral hindbrain are shown at: A: 48 hours post-fertilization (hpf); B: 72 hpf; C: 96 hpf; D: 8 dpf. In A, the white arrow shows a P0-immunoreactive premyelinating oligodendrocyte; the black arrows indicate fine P0-immunoreactive processes arising from this and similar cells. In B–D, black arrows indicate longitudinally arranged myelinating fibers. White arrows in D show myelinating commissural fibers. E: Hindbrain, transverse section, 14 dpf; arrow demarcates P0 expression in cranial nerve roots emerging from the ventral surface of the developing brainstem. F: Spinal cord, transverse section, 10 dpf; arrows indicate locations of P0-expressing spinal tracts. G: Higher-magnification view of ventral spinal cord from panel F, arrow indicates P0 expression in a ventral spinal nerve root. H: Longitudinal and I,J: transverse sections of the spinal cord, 24 dpf; arrow in J indicates P0 expression in a ventral nerve root. K: Optic nerve, longitudinal section at 7 dpf. L: Optic chiasm, transverse section at 8 dpf. M: Optic tectum, longitudinal section, 10 dpf; arrow indicates P0-immunoreactive processes of oligodendrocyte shown in center of panel. N: Optic tectum, transverse section, 24 dpf; arrows show P0-immunmoreactive fibers of optic tract entering the tectum. O: mesencephalon and diencephalon, transverse section, 28 dpf. P: Telencephalon and eyes, transverse section, 28 dpf. EXPRESSION / LABELING:
|
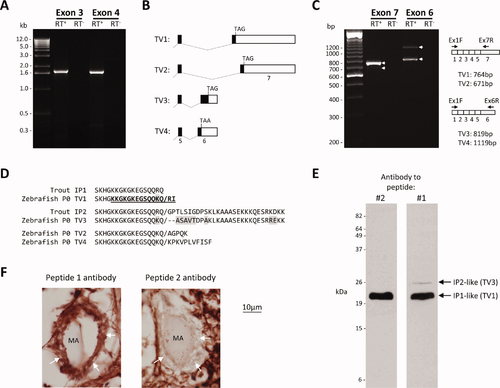
Alternative splicing of mpz gives rise to P0 isoforms with divergent C-termini. A: RNA derived from adult brain was subjected to reverse transcription using a 32RACE adapter primer (RT+, lanes 2 and 4), or treated with buffer alone (RT-, lanes 3 and 5). The resulting cDNA was subjected to PCR amplification using mpz-specific 52 primers hybridizing to exon 3 (lanes 2 and 3) or exon 4 (lanes 4 and 5), and a 32RACE adapter primer. Lane 1 shows a molecular marker; the sizes of the fragments (kb) are annotated to the left of the image. B: The diagram (not to scale) illustrates the splicing events giving rise to four mpz transcript variants (TV1–4). TV1 and TV2 were cloned by 32RACE; TV3 and TV4 were identified in silico and cloned by RT-PCR (see text). C: RNA derived from adult brain was subjected to reverse transcription using an oligo-dT primer (RT+, lanes 2 and 4), or treated with buffer alone (RT-, lanes 3 and 5). The resulting cDNA was subjected to PCR amplification using mpz-specific primers hybridizing to exon 1 and either exon 7 (lanes 2 and 3) or exon 6 (lanes 4 and 5). Lane 1 shows a molecular marker; the sizes of the fragments (bp) are annotated to the left of the image. The schematic to the right of the gel image illustrates the exon structures of the transcripts and the sizes of the expected PCR products for each transcript variant; arrows on the gel image delineate PCR products corresponding to the four transcript variants. D: The sequence alignment shows the C termini of the deduced P0 protein sequences encoded by the four zebrafish mpz transcript variants, and trout IP1 and IP2. The proteins encoded by mpz TV1 and TV3 show homology to trout IP1 and IP2, respectively. The sequence of peptide 2 used to generate the antibody used in Figures 2, 3, 4, 5, 6, 7, 2–7 is indicted within the sequence encoded by TV1 in bold type and underlined. Shading shows amino acid differences between the zebrafish and trout proteins. E: Identical western blots containing zebrafish whole brain lysate were probed using either the antibody to peptide 2 (shown in Figs. 2, 3, 4, 5, 6, 7, 2–7), or affinity-purified antibody to peptide 1. The additional 26 kDa band recognized by peptide 1 antibody is indicated. F: Photomicrographs showing high-magnification images of Mauthner axons in the ventral spinal cord, in cross-section. The myelin sheath of the Mauthner axon is indicated with white arrows. The section shown in the left panel was labeled with peptide 1 antibody (extracellular domain, sequence common to all isoforms). The section on the right was labeled with peptide 2 antibody (C-terminus, alternatively spliced). P0 immunoreactivity was revealed by a histochemical reaction with a red product. |