
Fig. 1
- ID
- ZDB-FIG-110621-25
- Publication
- Bai et al., 2011 - Major isoform of zebrafish P0 is a 23.5 kDa myelin glycoprotein expressed in selected white matter tracts of the central nervous system
- Other Figures
- All Figure Page
- Back to All Figure Page
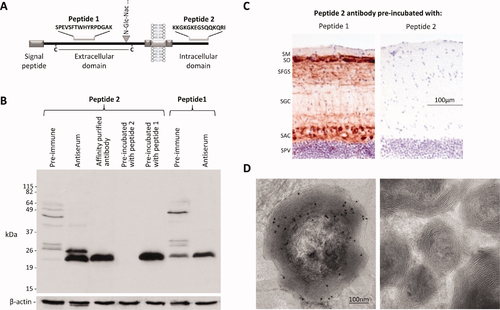
Development of specific antibodies against zebrafish P0. A: The diagram shows the predicted domain organization of zebrafish P0, illustrating key features discussed in the text. The positions and sequences of the two peptides used to raise P0 antibodies are shown. B: Zebrafish whole brain lysate (50 μg protein/lane) was separated by SDS-PAGE and transferred to PVDF membrane. The resulting western blot was divided into strips, allowing each lane to be probed using a different primary antibody: 1) preimmune serum from an animal subsequently immunized with peptide 2; 2) antiserum from the same animal following immunization with peptide 2; 3) affinity-purified antibody against peptide 2 derived from the serum shown in lane 2 (this is referred to as “P0 antibody”in Figs. 2, 3, 4, 5, 6, 7, 2–7); 4) affinity-purified antibody shown in lane 3, preincubated with peptide 2; 5) affinity-purified antibody shown in lane 3, preincubated with peptide 1; 6) preimmune serum from an animal subsequently immunized with peptide 1; 7) antiserum from the same animal following immunization with peptide 1. After incubation with secondary antibody, the strips were reassembled into the original blot, prior to the application of chemiluminescent reagent, in order to allow direct comparison between lanes. The blot was subsequently reprobed with an antibody to β-actin in order to verify equal protein loading in each lane (bottom panel). C: Cryosections encompassing the optic tectum were labeled immunohistochemically using affinity-purified peptide 2 antibody (shown in lane 3 of panel B). The antibody was preincubated with peptide 2, containing its cognate epitope (right panel), or with peptide 1 at the same concentration, as a negative control (left panel). Bound antibody was detected using a histochemical reaction with a red product. A blue nuclear counterstain was used in order to facilitate identification of tectal laminae. The scale bar for both panels is shown in the right panel. D: Transmission electron micrographs of adult zebrafish spinal cord showing myelinated axons in cross-section. The specimen on the left was immunolabeled with affinity-purified peptide 2 antibody (shown in lane 3 of panel B). The secondary antibody was conjugated to 10 nm colloidal gold and the specimen counterstained with uranyl acetate; immunoreactivity appears as small black circles. The panel on the right shows a control sample that was processed identically, except that primary antibody was omitted. |
| Gene: | |
|---|---|
| Antibody: | |
| Fish: | |
| Anatomical Terms: | |
| Stage: | Adult |