
- Title
-
Live Imaging of Innate Immune Cell Sensing of Transformed Cells in Zebrafish Larvae: Parallels between Tumor Initiation and Wound Inflammation
- Authors
- Feng, Y., Santoriello, C., Mione, M., Hurlstone, A., and Martin, P.
- Source
- Full text @ PLoS Biol.
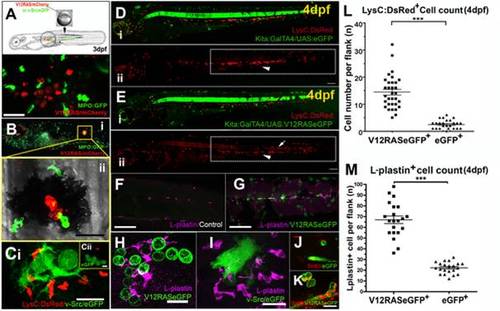
Activation of leukocytes in zebrafish larvae by oncogene-transformed cells. (A) Schematic of the procedure for transient induction of V12RAS/v-Src in embryos that also have fluorescently tagged neutrophils, with an example of a V12RAS+ melanoblast clone (red) in a 3-dpf larva also expressing eGFP (green) in neutrophils. (B) (i) A 5-dpf MPO:GFP larva with a V12RAS+ clone (red). (ii) High-magnification view of the inset in (i), which is a single image from a time-lapse movie (Video S1A) of GFP-tagged neutrophils actively interacting with a V12RAS+ clone; note that most of the red fluorescent signal is quenched by melanocyte pigment. (C) (i) A single image from a time-lapse movie showing LysC:DsRed+ cells recruited by v-Src+ (green) cells in a 3-dpf larva (Video S2B). (ii) An equivalent image from a time-lapse movie showing no recruitment of LysC:DsRed+ cells to GAP43-eGFP-expressing cells in a control larva (Video S2A). (D) (i) Low-magnification, two-channel, lateral view of a control Tg (kita:GalTA4, UAS:eGFP, LysC:DsRed) larva at 4 dpf. (ii) Single-channel view to highlight only the DsRed-tagged leukocytes. The box highlights these cells located within the hematopoietic tissue. Arrowhead indicates LysC:DsRed+ cells in the hematopoietic tissue. (E) As for (D) but of a Tg (kita:GalTA4, UAS:V12RASeGFP, LysC:DsRed) larva at 4 dpf. The boxed zone in (ii) indicates how the LysC:DsRed+ cells have largely dispersed from the hematopoietic tissue into the flank skin. Arrowhead indicates LysC:DsRed+ cells in the hematopoietic tissue; arrow indicates LysC:DsRed+ cells in the skin tissue. (F) A confocal Z-stack projection of the flank of a control larva in the trunk region. (G) Equivalent image to (F) but of a V12RAS+ larva. Both are stained with the anti-L-plastin antibody (magenta). (H) A high-magnification view of a larva similar to that in (G), illustrating the association of L-plastin+ cells (magenta) with V12RAS+ cells (green). (I) A similar larvae to that in (H), but with v-Src-expressing cells (green). (J) Anti-BrdU (red) immunostaining of control mucus-secreting cells (green). (K) Anti-BrdU (Red) immunostaining of V12RAS+ mucus-secreting cells (green). (L) Quantification of numbers of LysC:DsRed+ cells present in the skin of the trunk in the region indicated by boxes in (D) and (E). (M) Quantification of the number of L-plastin+ cells present in the trunk epidermis in regions shown in (F) and (G). ***, p<0.001. Scale bars: (A), 48 μm; (B,C), 24 μm; (D–G), 150 μm; (H–K), 20 μm. |
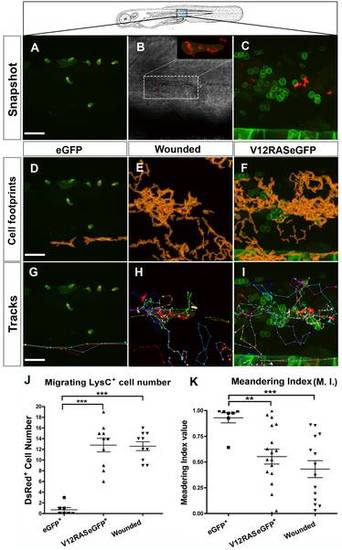
Comparison of leukocyte recruitment to V12RAS+ transformed cells versus to a wound. (A) Confocal image of the trunk epidermis (region indicated by schematic) from a movie of a control Tg(kita:GalTA4, UAS:eGFP, LysC:DsRed) larva (Video S3A). (B) DIC image of a skin laser wound in the same region of the trunk as the transformed cells in (C). Inset is a confocal image of the wound highlighting how LysC:DsRed+ cells are recruited to the wound center (Video S3B). (C) Equivalent image to (A) but from a Tg(kita:GalTA4, UAS:V12RASeGFP, LysC:DsRed) larva (Video S3C). (D–F) Superimposition of DsRed+ cell profiles (orange) from all time frames of 80-min time-lapse movies of (D) control, (E) wounded, and (F) V12RAS+ larvae, to reveal cumulative footprints (orange). (G–I) as for (D–F) but with tracks of all the LysC:DsRed+ cells that migrated within the field of view of the movies superimposed onto a single movie still. (J) Quantification of the numbers of LysC:DsRed+ cells that migrate through the imaging fields of control, V12RAS+, and wounded larvae. (K) As for (J) but quantification of the cell MI for each of these conditions. **, p<0.01; ***, p<0.001. Scale bars = 48 μm for all the images. In all images larvae are 4-dpf. EXPRESSION / LABELING:
|
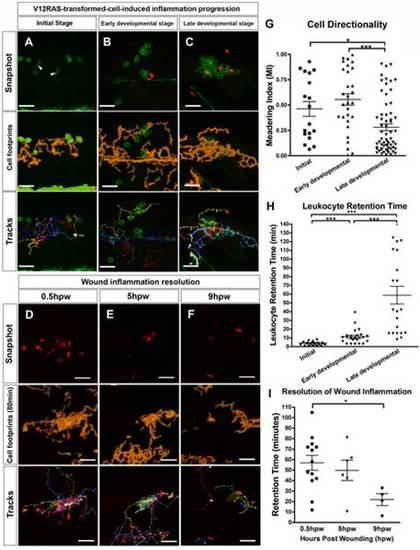
Time-lapse analysis of leukocyte response to V12RAS+ clone expansion versus wound inflammatory response. (A) Single image from a movie taken of the trunk region of a Tg(kita:GalTA4, UAS:V12RASeGFP, fli:eGFP) larva, showing an “initial stage” clone of V12RAS+ cells. Rounded cells with membrane-tagged GFP are V12RAS+ cells; solid green migrating cells are Fli:eGFP+ leukocytes (arrowheads) (Video S5A). (B and C) Images from “early developmental” and “late developmental” stage clones in Tg(kita:GalTA4, UAS:V12RASeGFP, LysC:DsRed) larvae (Video S5B and S5C). (D–F) Early (D), medium (E), and late stages (F) of flank laser wounds made to Tg(kita:GalTA4, UAS:eGFP, LysC:DsRed) larval skin (Video S4). Middle panels for (A–F) are the superimposed outlines of cumulated leukocyte footprints (orange) over time-lapse duration. The lower panels are superimposed tracks of all the leukocytes that have migrated through the imaging field during this period (Video S4 and S5). (G) Quantification of the MI of leukocyte migration in the presence of initial, early developmental, and late developmental stages of V12RAS+ clones in the epidermis. (H) Quantification of “retention time” of the leukocytes that are recruited to V12RAS+ clones at initial, early developmental, and late developmental stages. (I) Quantification of the “retention time” of leukocytes recruited during initial, early developmental, and late developmental stages of flank laser wounding of larval skin. *, p<0.05; ***, p<0.001. Scale bars = 48 μm. |
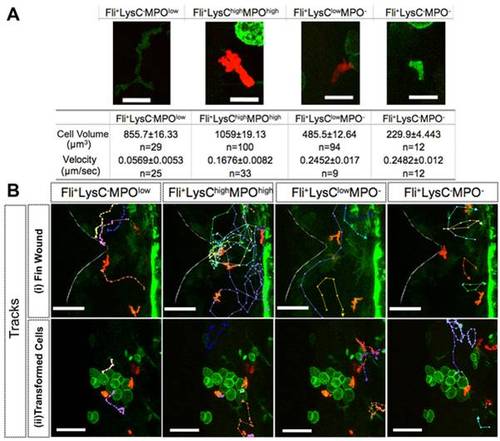
Distinguishing four leukocyte subtypes in zebrafish larvae and their response to a wound versus that to the presence of transformed cells. (A) Features of four leukocyte subtypes, as illustrated by typical examples from Tg(fli:eGFP, LysC:DsRed)larvae (Video S6). (B) (i) Tracks of each leukocyte subtype from a movie (Video S6A) of the wound inflammatory response in a Tg(fli:eGFP, LysC:DsRed) larva, illustrating how each responds to a wound. Faint white line indicates the wound edge. (ii) Similar tracking data from a movie (Video S7B) of a Tg(kita:GalTA4, UAS:V12RASeGFP, fli:eGFP, LysC:DsRed) larva showing that all subtypes of leukocyte are responding to V12RAS+ cells. Scale bars: (A), 16 μm; (B), 50 μm. |
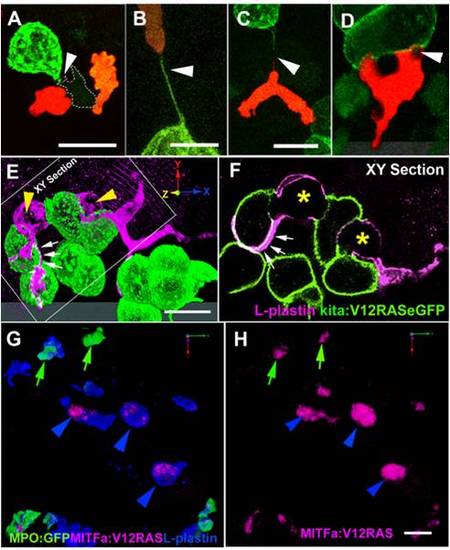
Dynamic interactions between leukocytes and V12RAS+ transformed cells. (A) A confocal image of a LysC:DsRed+ (red) cell and a macrophage (faint green with dotted outline) interacting with a V12RAS+ cell (green) (Video S8). (B and C) Images showing LysC:DsRed+ leukocytes establishing tethers with V12RAS+ cells, as observed in Tg(fli:eGFP, LysC:DsRed, kita:GalTA4, UAS:V12RASeGFP) larvae: (B) shows a tether entirely composed of V12RAS cytoplasm (green) (Video S9); (C) shows a chimeric tether composed of both V12RAS (green) and LysC:DsRed+ (red) cytoplasm. (D) A single image from a 3-D movie (Video S10) of a neutrophil as it glides over and engulfs pieces of a V12RAS+ cell; (E) 3-D reconstruction of a V12RAS+ cell clump (green cells) showing two macrophages (L-plastin+, magenta staining, yellow arrowheads) as they deform to engulf individual V12RAS+ cells. Small white arrows and dotted outline indicate lamellipodial protrusions extending over another pair of transformed cells. (F) A single focal plane (corresponding to that indicated in [E]) of the same pair of macrophages, showing V12RAS+-cell-shaped phagosomes (asterisks) within them. One macrophage has partially enveloped another V12RAS+ cell with a thin lamellipodial extension (indicated by small white arrows). (G) 3-D reconstruction of an anti-L-plastin-stained mitfa:V12RAS-mitfa:mCherry-injected Tg(BACmpo:eGFP)i114 larval flank region, showing the presence of mCherry+ (red) debris within L-plastin+MPO- cells. (H) Image as in (G) but with single channel to highlight the mCherry+V12RAS+ debris; green arrows indicate co-localization within L-plastin+MPO+ neutrophils; blue arrowheads indicate co-localization within L-plastin+MPO- macrophages. Note that the larger clumps of debris all reside within macrophages. Scale bars = 16 μm. |
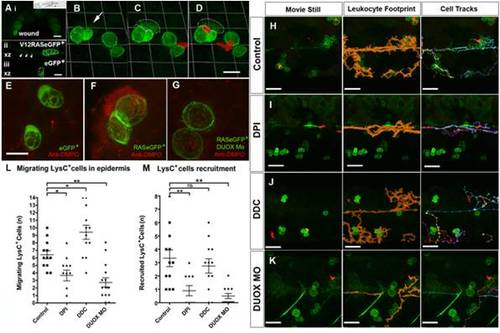
Local synthesis of H2O2 is required for leukocyte recruitment toward V12RAS+ cells. (A) (i) Wound edge of a larva pre-loaded with H2O2-indicating dye (acetyl-pentafluorobenzene sulphonyl fluorescein) to reveal H2O2 synthesis (green), 10 min after wounding; the wound location corresponds to the arrow in inset schematic; (ii) and (iii) Confocal Z-sections (corresponding to the transect line in inset) through the skin of larvae pre-loaded with acetyl-pentafluorobenzene sulphonyl fluorescein. (ii) is from a V12RAS+ larva, with dotted outline indicating the V12RAS+ cells. Arrowheads indicate increased H2O2 signal in the skin of the V12RAS larva. (iii) is a control larva with non-transformed eGFP-expressing mucus-secreting cells outlined, indicating reduced background H2O2 levels. (B–D) Stills from a time-lapse movie showing transient H2O2 production and subsequent recruitment of LysC:DsRed+ cells towards V12RAS+ cells. Arrow in (B) and dotted line in (C) and (D) indicate the region where H2O2 pulse occurs prior to LysC:DsRed+ cell recruitment (Video S11). (E–G) Anti-DMPO antibody (red “mist”) detection of DMPO-protein adducts in larvae with control eGFP-expressing goblet cells (E), V12RASeGFP-transformed goblet cells (F), and V12RASeGFP-transformed goblet cells with DUOX morpholino knockdown (G). (H–K) Analysis of time-lapse movies from control (H), DPI-treated (I), DDC-treated (J), and DUOX-morpholino-injected (K) V12RAS+LysC+ larvae. In (H–K) the left-hand panel shows a still image from the time-lapse movie (Video S12), the middle panel shows the superimposed, cumulative footprints (orange) of all the leukocytes during the 120-min period of the movie, and the right-hand panel shows the superimposed tracks of all the leukocytes that migrated through the imaging field during this period. (L) Quantification of LysC:DsRed+ cell number during the 120-min time course of the movie. (M) Quantification of LysC:DsRed+ cell contacts with V12RAS+ cells during the same 120-min time course. *, p<0.05, **, p<0.01; ns, not significant. Scale bars: (A–D), 24 μm; (E–G), 16 μm; (H–K), 50 μm. |
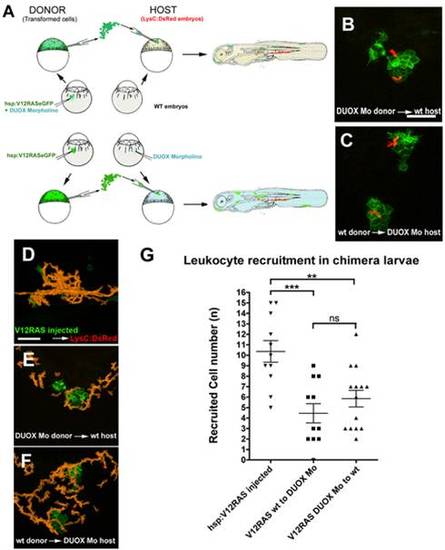
Analysis of leukocyte recruitment in chimeric V12RAS-transformed cell-bearing larvae. (A) Schematic diagram to illustrate how we generate chimeric V12RAS+ transformed cell-bearing Tg(LysC:DsRed) larvae, in which either the donor transformed cells or host tissues are morphant for DUOX. (B) A still image from Video S13B illustrating how LysC:DsRed+ cells are recruited to DUOX morphant V12RAS+ cells in WT host environment. (C) A still image from Video S13C showing LysC:DsRed+ cells recruited to WT V12RAS+ cells in a DUOX morphant host environment. (D–F) Cumulative LysC:DsRed+ cell footprints (orange) of representative movies shown in Video S13. (G) Graph to illustrate numbers of recruited LysC+ cells drawn towards V12RAS+ transformed cells in the two transplantation scenarios above compared with pTol2-hsp:V12RASeGFP injected into Tg(LysC:DsRed) control. **, p<0.01; ***, p<0.001; ns, not significant. Scale bars = 50 μm. |
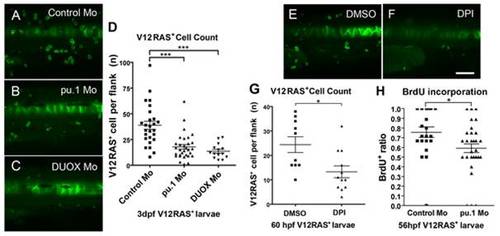
Analysis of transformed cell clones in larvae where immune cell interaction is disrupted. (A–C) Typical confocal Z-projections of 3-dpf V12RAS+ larvae that were previously injected with (A) control (n = 26), (B) pu.1 (n = 31), and (C) DUOX (n = 14) morpholinos. (D) Quantification of the numbers of V12RAS+ cells in equivalent flank skin within these three groups at 3 dpf. (E and F) Typical confocal Z-projection images of control and DPI-treated larvae at 60 hpf for similar analysis of V12RAS+ cells. (G) Quantification of V12RAS+ cell numbers in control (n = 10) versus DPI-treated (n = 12) larvae at 60 hpf; *, p<0.05; ***, p<0.001. (H) Graphic representation of BrdU incorporation by V12RAS+ cells in pu.1 morphant (n = 33) versus control (n = 21) larvae. Each point on the scatter plots represents one larva. Scale bar = 150 μm. EXPRESSION / LABELING:
|
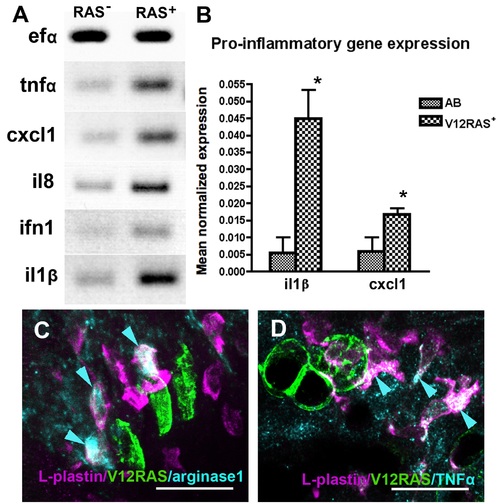
V12RAS induces pro-inflammatory gene up-regulation in zebrafish larvae. (A) RT-PCR showing up-regulation of pro-inflammatory genes in V12RAS+ larvae at 4dpf compared with their V12RAS- siblings. (B) qPCR showing increased expression of il1² and cxcl1 in 5-dpf hsp:V12RASeGFP larvae compared with WT after both have been heat shocked for 6 h. (C) Fluorescent in situ hybridization of arginase1 (cyan) combined with L-plastin antibody staining for leukocytes (magenta) and anti-RAS antibody staining for V12RAS+ cells (green) in 7-dpf V12RAS+ larvae. (D) Anti-TNFα antibody staining (cyan) combined with anti-L-plastin antibody staining for leukocytes (magenta) in 7-dpf larvae with V12RASeGFP+ clones (green)-arrowheads indicate TNFα signal inside some of the L-plastin+ cells. *, p<0.05. Scale bars = 20 μm. |
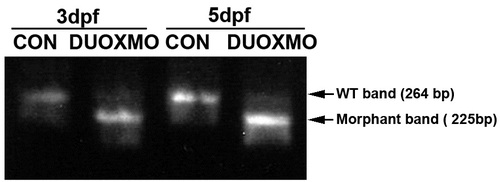
RT-PCR for DUOX Showing the efficiency of the DUOX splicing block morpholino. DUOX-morphant-typing primers amplify a 264-bp WT band from the cDNA of control, un-injected embryos, but embryos injected with DUOX morpholino exhibit exon escape, resulting in a 39-bp deletion of mRNA such that DUOX-morphant-typing primers amplify a smaller band from cDNA of DUOX morphant embryos. This knockdown is full at 3 dpf and retained until 5 dpf. |