
Fig. 8
- ID
- ZDB-FIG-110111-19
- Publication
- Feng et al., 2010 - Live Imaging of Innate Immune Cell Sensing of Transformed Cells in Zebrafish Larvae: Parallels between Tumor Initiation and Wound Inflammation
- Other Figures
- All Figure Page
- Back to All Figure Page
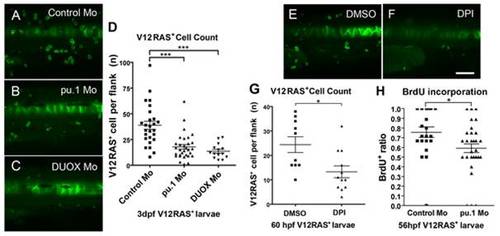
Analysis of transformed cell clones in larvae where immune cell interaction is disrupted. (A–C) Typical confocal Z-projections of 3-dpf V12RAS+ larvae that were previously injected with (A) control (n = 26), (B) pu.1 (n = 31), and (C) DUOX (n = 14) morpholinos. (D) Quantification of the numbers of V12RAS+ cells in equivalent flank skin within these three groups at 3 dpf. (E and F) Typical confocal Z-projection images of control and DPI-treated larvae at 60 hpf for similar analysis of V12RAS+ cells. (G) Quantification of V12RAS+ cell numbers in control (n = 10) versus DPI-treated (n = 12) larvae at 60 hpf; *, p<0.05; ***, p<0.001. (H) Graphic representation of BrdU incorporation by V12RAS+ cells in pu.1 morphant (n = 33) versus control (n = 21) larvae. Each point on the scatter plots represents one larva. Scale bar = 150 μm. |
| Gene: | |
|---|---|
| Fish: | |
| Knockdown Reagents: | |
| Anatomical Term: | |
| Stage: | Protruding-mouth |