|
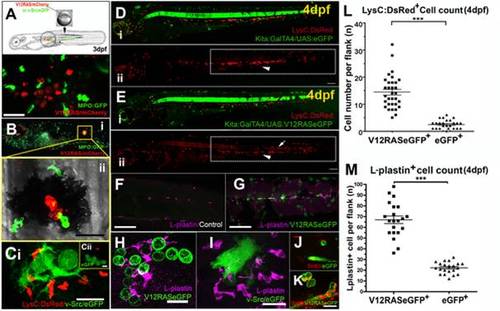
Activation of leukocytes in zebrafish larvae by oncogene-transformed cells. (A) Schematic of the procedure for transient induction of V12RAS/v-Src in embryos that also have fluorescently tagged neutrophils, with an example of a V12RAS+ melanoblast clone (red) in a 3-dpf larva also expressing eGFP (green) in neutrophils. (B) (i) A 5-dpf MPO:GFP larva with a V12RAS+ clone (red). (ii) High-magnification view of the inset in (i), which is a single image from a time-lapse movie (Video S1A) of GFP-tagged neutrophils actively interacting with a V12RAS+ clone; note that most of the red fluorescent signal is quenched by melanocyte pigment. (C) (i) A single image from a time-lapse movie showing LysC:DsRed+ cells recruited by v-Src+ (green) cells in a 3-dpf larva (Video S2B). (ii) An equivalent image from a time-lapse movie showing no recruitment of LysC:DsRed+ cells to GAP43-eGFP-expressing cells in a control larva (Video S2A). (D) (i) Low-magnification, two-channel, lateral view of a control Tg (kita:GalTA4, UAS:eGFP, LysC:DsRed) larva at 4 dpf. (ii) Single-channel view to highlight only the DsRed-tagged leukocytes. The box highlights these cells located within the hematopoietic tissue. Arrowhead indicates LysC:DsRed+ cells in the hematopoietic tissue. (E) As for (D) but of a Tg (kita:GalTA4, UAS:V12RASeGFP, LysC:DsRed) larva at 4 dpf. The boxed zone in (ii) indicates how the LysC:DsRed+ cells have largely dispersed from the hematopoietic tissue into the flank skin. Arrowhead indicates LysC:DsRed+ cells in the hematopoietic tissue; arrow indicates LysC:DsRed+ cells in the skin tissue. (F) A confocal Z-stack projection of the flank of a control larva in the trunk region. (G) Equivalent image to (F) but of a V12RAS+ larva. Both are stained with the anti-L-plastin antibody (magenta). (H) A high-magnification view of a larva similar to that in (G), illustrating the association of L-plastin+ cells (magenta) with V12RAS+ cells (green). (I) A similar larvae to that in (H), but with v-Src-expressing cells (green). (J) Anti-BrdU (red) immunostaining of control mucus-secreting cells (green). (K) Anti-BrdU (Red) immunostaining of V12RAS+ mucus-secreting cells (green). (L) Quantification of numbers of LysC:DsRed+ cells present in the skin of the trunk in the region indicated by boxes in (D) and (E). (M) Quantification of the number of L-plastin+ cells present in the trunk epidermis in regions shown in (F) and (G). ***, p<0.001. Scale bars: (A), 48 μm; (B,C), 24 μm; (D–G), 150 μm; (H–K), 20 μm.
|