
Fig. 6
- ID
- ZDB-FIG-110111-17
- Publication
- Feng et al., 2010 - Live Imaging of Innate Immune Cell Sensing of Transformed Cells in Zebrafish Larvae: Parallels between Tumor Initiation and Wound Inflammation
- Other Figures
- All Figure Page
- Back to All Figure Page
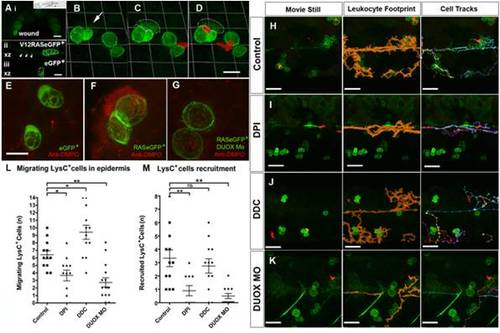
Local synthesis of H2O2 is required for leukocyte recruitment toward V12RAS+ cells. (A) (i) Wound edge of a larva pre-loaded with H2O2-indicating dye (acetyl-pentafluorobenzene sulphonyl fluorescein) to reveal H2O2 synthesis (green), 10 min after wounding; the wound location corresponds to the arrow in inset schematic; (ii) and (iii) Confocal Z-sections (corresponding to the transect line in inset) through the skin of larvae pre-loaded with acetyl-pentafluorobenzene sulphonyl fluorescein. (ii) is from a V12RAS+ larva, with dotted outline indicating the V12RAS+ cells. Arrowheads indicate increased H2O2 signal in the skin of the V12RAS larva. (iii) is a control larva with non-transformed eGFP-expressing mucus-secreting cells outlined, indicating reduced background H2O2 levels. (B–D) Stills from a time-lapse movie showing transient H2O2 production and subsequent recruitment of LysC:DsRed+ cells towards V12RAS+ cells. Arrow in (B) and dotted line in (C) and (D) indicate the region where H2O2 pulse occurs prior to LysC:DsRed+ cell recruitment (Video S11). (E–G) Anti-DMPO antibody (red “mist”) detection of DMPO-protein adducts in larvae with control eGFP-expressing goblet cells (E), V12RASeGFP-transformed goblet cells (F), and V12RASeGFP-transformed goblet cells with DUOX morpholino knockdown (G). (H–K) Analysis of time-lapse movies from control (H), DPI-treated (I), DDC-treated (J), and DUOX-morpholino-injected (K) V12RAS+LysC+ larvae. In (H–K) the left-hand panel shows a still image from the time-lapse movie (Video S12), the middle panel shows the superimposed, cumulative footprints (orange) of all the leukocytes during the 120-min period of the movie, and the right-hand panel shows the superimposed tracks of all the leukocytes that migrated through the imaging field during this period. (L) Quantification of LysC:DsRed+ cell number during the 120-min time course of the movie. (M) Quantification of LysC:DsRed+ cell contacts with V12RAS+ cells during the same 120-min time course. *, p<0.05, **, p<0.01; ns, not significant. Scale bars: (A–D), 24 μm; (E–G), 16 μm; (H–K), 50 μm. |