
- Title
-
A transgenic zebrafish for monitoring in vivo microtubule structures
- Authors
- Asakawa, K., and Kawakami, K.
- Source
- Full text @ Dev. Dyn.
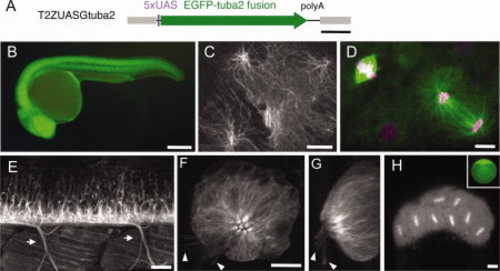
Labeling of microtubules (MTs) with green fluorescent protein (GFP) -tagged tubulin in various cell types. A: Structure of the T2ZUASGtuba2 construct. The Tol2 sequence and UAS are shown in gray and purple, respectively. The tuba2 tagged with the EGFP gene is shown with a green arrow. B: The SAGFF73A; UAS:Gtuba2 embryo at 24 hours postfertilization (hpf). C: The epithelial cells of the head region of the SAGFF73A; UAS:Gtuba2 larva at 5 days postfertilization (dpf). D: The cells of the external enveloping layer cells of SAGFF73A; UAS:Gtuba2 embryo at 12 hpf. The embryo had been injected with pT2ZUASH2AR at the one cell stage. Gtuba2 and H2AR signals are shown in green and magenta, respectively. E: The lateral view of the trunk of the SAGFF73A; UAS:Gtuba2 larva including the spinal cord and the skeletal muscle at 5 dpf. Arrows indicate motor axons innervating the skeletal muscles. F,G: The neuromast of the SAGFF73A; UAS:Gtuba2 larva at 5 dpf. H: The embryo laid by the SAGFF73A;UAS:Gtuba2 female at the 32-cell stage; Inset: an egg laid by the SAGFF73A;UAS:GFP female. UAS, upstream activating sequence. Scale bars = 500 bp in A; 250 μm in B,G; 10 μm in C,D,F; 20 μm in E; 50 μm in H. |
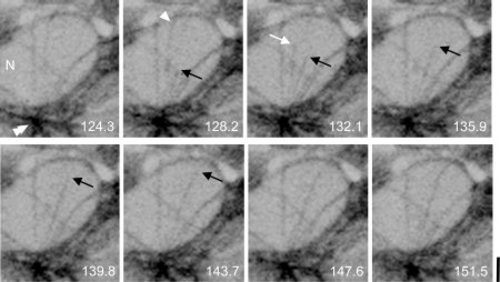
Time lapse imaging of single microtubules (MTs). Serial images of a skin cell in the SAGFF73A;UAS:Gtuba2 larvae at 108 hours postfertilization (hpf). The green fluorescent protein (GFP) signal is shown in black. The MT that was present just before shrinking is indicated by the arrowhead. The shrinking end of the MT is indicated by the white arrow. The shrinking end is not evident in the next frame. The growing end of the other MT is indicated by the black arrow. The growth rate of this MT is in a range of 13.0–25.9 μm/min from t = 128.2 to 139.8, which is slightly faster than that observed in mammalian LLCPK-1 cells (Rusan et al.2001). The oval-shaped GFP-negative region (N) is the nucleus. The position of the putative MT-organizing center is indicated by the double arrowhead. The numbers in white indicate the time points in seconds. Scale bar = 2 μm. |
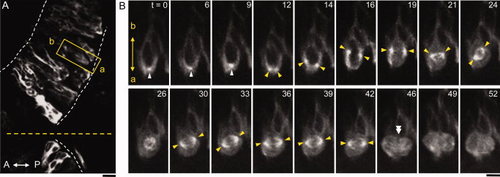
Time lapse imaging of mitosis in the developing hindbrain. A: The dorsal view of the developing cerebellar region in the hspGGFF27A:UAS:Gtuba2 embryo at 54 hours postfertilization (hpf). The anterior is to the left. White dotted lines demarcate the developing cerebellum. The yellow dotted line indicates the midline. The division of the progenitor cell in the yellow box is monitored by time lapse imaging. The a and b indicate the apical and basal side of the cerebellum, respectively. Scale bars = 10 μm. B: Time lapse imaging of a progenitor cell in the yellow box in A. White arrowheads indicate the position of the centrosomes before separation. Yellow arrowheads indicate the separated centrosomes. The double arrowhead (t = 46) indicates the position of the cleavage furrow. The positions of the centrosomes were unclear at t = 26. The numbers in white indicate the time points in minutes. Scale bars = 10 μm in A; 5μm in B. |
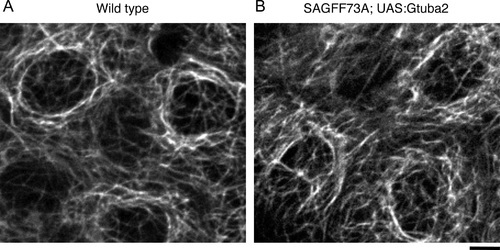
Immunostaining of MTs. The skin cells of the wild type (A) and SAGFF73A;UAS:Gtuba2 (B) embryos at 48 hpf immunostained with anti-z&beta-ztubulin antibody. The bar indicates 5 μm. |
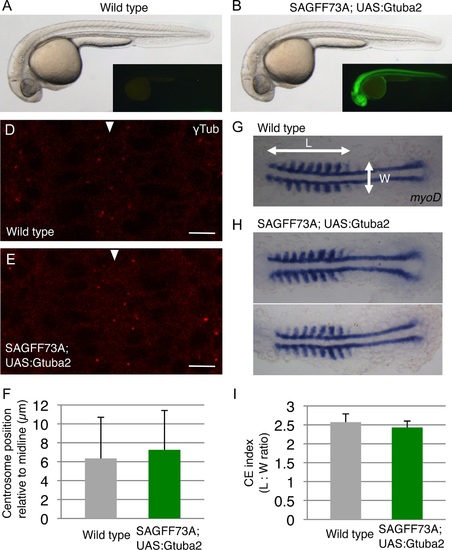
Effects of Gtuba2 expression on early developmental processes. Morphology of the wild type (A) and SAGFF73A;Gtuba2 (B) embryos at 28 hpf. Each inset shows GFP expression in the same embryo. The dorsal view of the neural tube at the somite 8-z9 level in the wild type (D) and SAGFF73A;Gtuba2 (E) embryos at the 10-zsomite stage. The anterior is to the top. Arrowheads indicate the position of the midline. The bars indicate 10 μm. (F) The centrosome position relative to the midline. The position of 99 and 105 centrosomes were analyzed in the wild type embryos (N=3) and SAGFF73A;Gtuba2 embryos (N=3), respectively. No significant difference in the centrosome position was (not) observed between the wild type and SAGFF73A;Gtuba2 embryos (p = 0.27). Developing somites visualized with myoD in the wild type (G) and SAGFF73A;Gtuba2 (H) embryos at the 9-z10 somite stage. (I) The extent of the anterior-zposterior elongation was quantified by measuring the length (somite 1-z9) : width ratio of the myoD signal (CE index, L : W ratio in panel G) in the wild type embryos (N=6) and SAGFF73A;Gtuba2 embryos (N=5), respectively. NO significant difference in the CE index was observed between the wild type and SAGFF73A;Gtuba2 embryos (p = 0.19). |