
Fig. 1
- ID
- ZDB-FIG-101111-9
- Publication
- Asakawa et al., 2010 - A transgenic zebrafish for monitoring in vivo microtubule structures
- Other Figures
- All Figure Page
- Back to All Figure Page
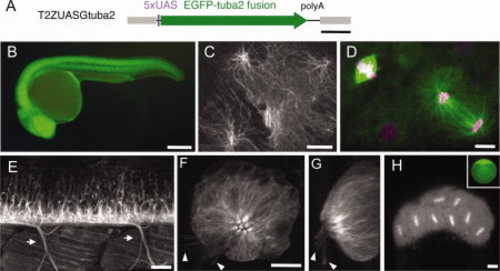
Labeling of microtubules (MTs) with green fluorescent protein (GFP) -tagged tubulin in various cell types. A: Structure of the T2ZUASGtuba2 construct. The Tol2 sequence and UAS are shown in gray and purple, respectively. The tuba2 tagged with the EGFP gene is shown with a green arrow. B: The SAGFF73A; UAS:Gtuba2 embryo at 24 hours postfertilization (hpf). C: The epithelial cells of the head region of the SAGFF73A; UAS:Gtuba2 larva at 5 days postfertilization (dpf). D: The cells of the external enveloping layer cells of SAGFF73A; UAS:Gtuba2 embryo at 12 hpf. The embryo had been injected with pT2ZUASH2AR at the one cell stage. Gtuba2 and H2AR signals are shown in green and magenta, respectively. E: The lateral view of the trunk of the SAGFF73A; UAS:Gtuba2 larva including the spinal cord and the skeletal muscle at 5 dpf. Arrows indicate motor axons innervating the skeletal muscles. F,G: The neuromast of the SAGFF73A; UAS:Gtuba2 larva at 5 dpf. H: The embryo laid by the SAGFF73A;UAS:Gtuba2 female at the 32-cell stage; Inset: an egg laid by the SAGFF73A;UAS:GFP female. UAS, upstream activating sequence. Scale bars = 500 bp in A; 250 μm in B,G; 10 μm in C,D,F; 20 μm in E; 50 μm in H. |