
|
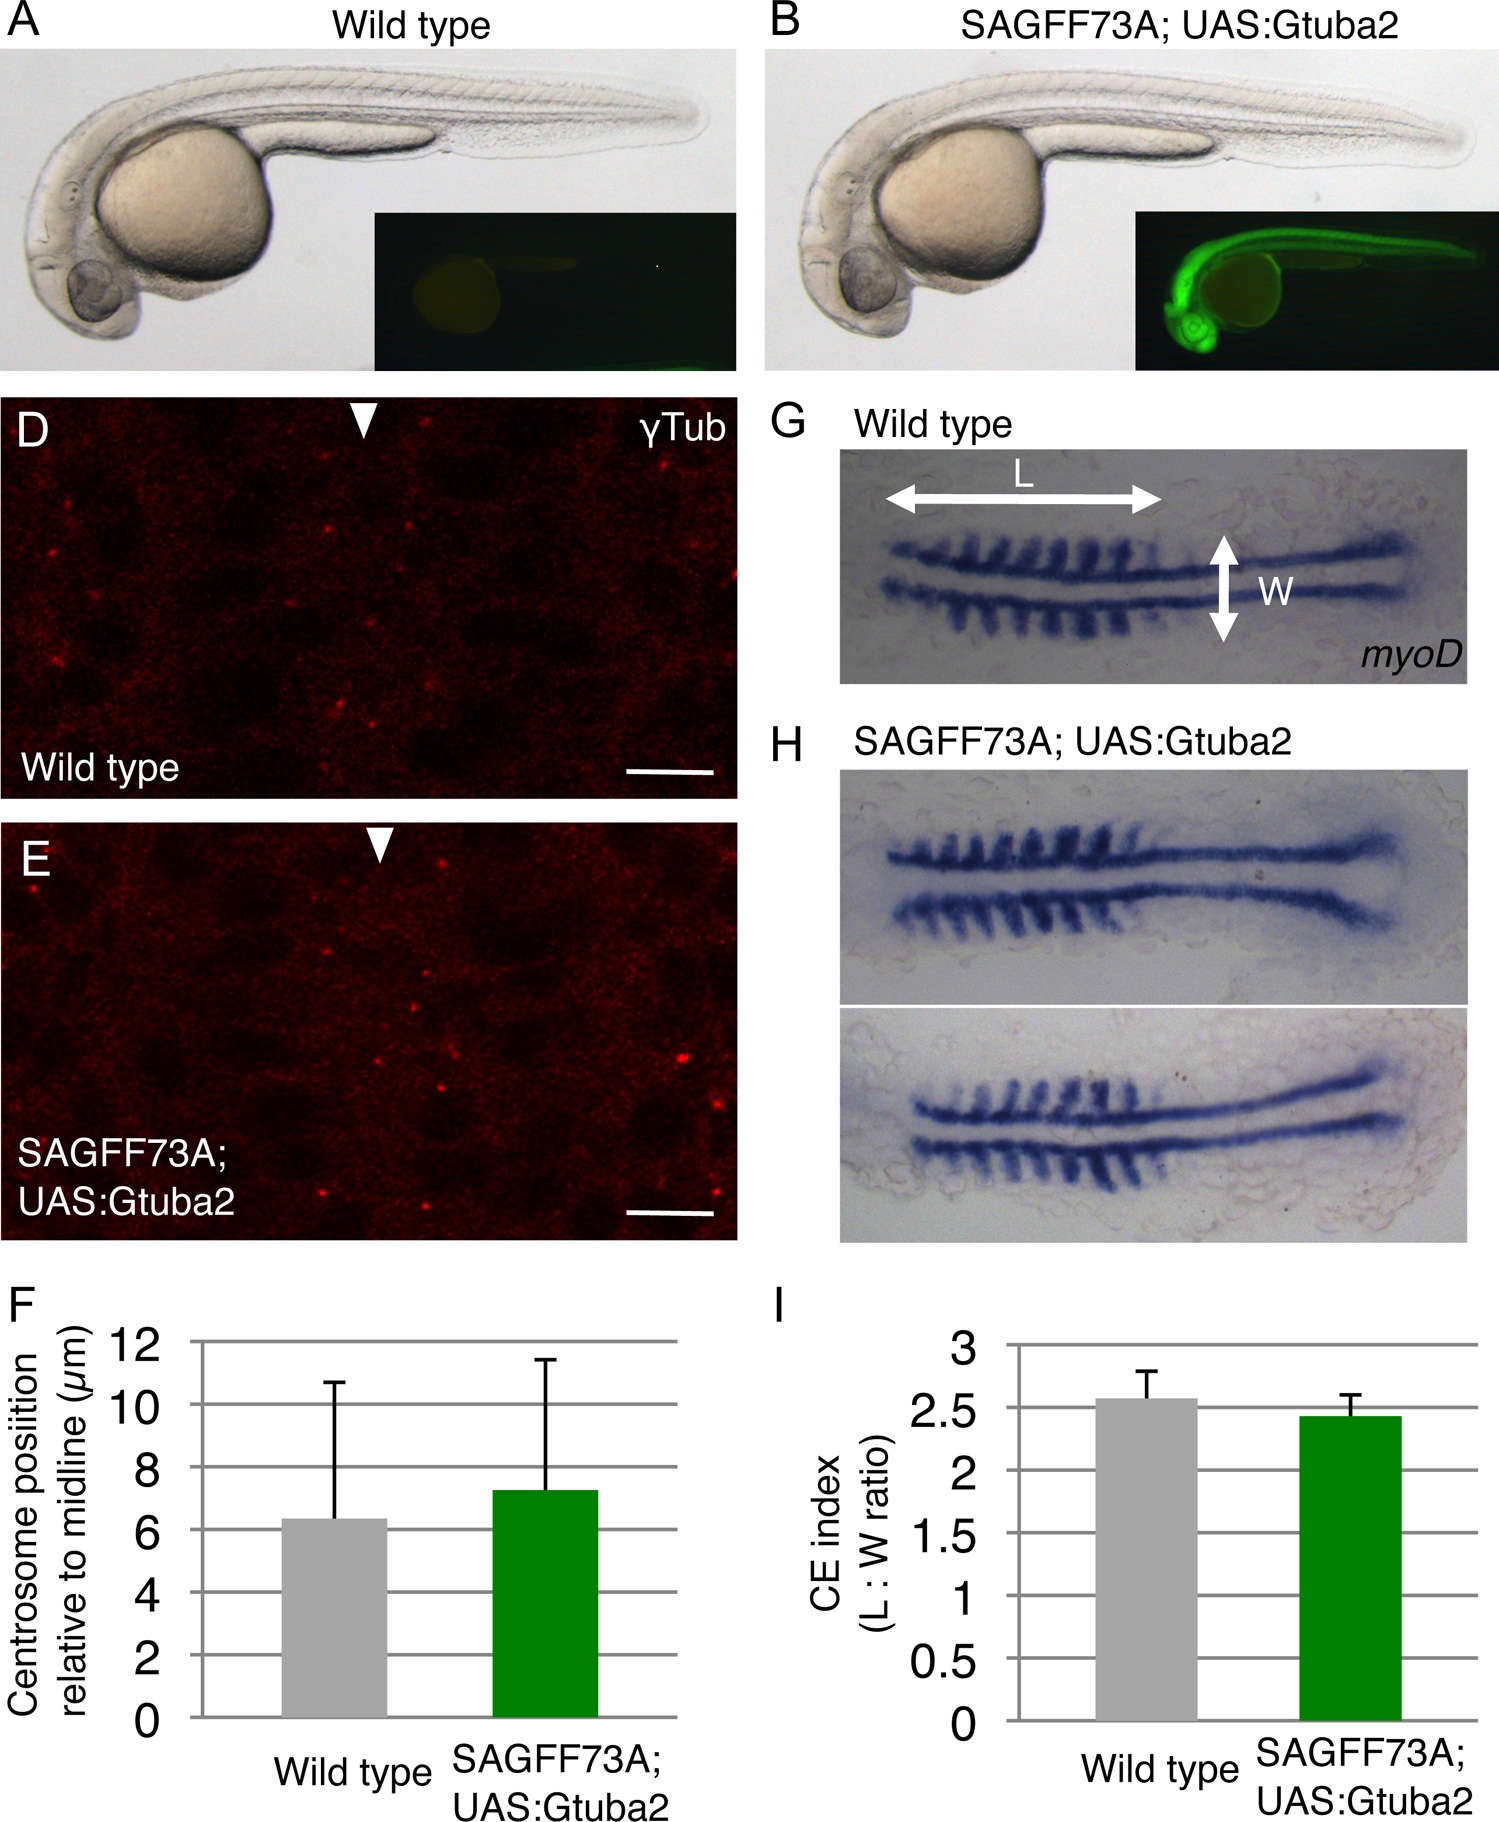
Fig. S2 Effects of Gtuba2 expression on early developmental processes. Morphology of the wild type (A) and SAGFF73A;Gtuba2 (B) embryos at 28 hpf. Each inset shows GFP expression in the same embryo. The dorsal view of the neural tube at the somite 8-z9 level in the wild type (D) and SAGFF73A;Gtuba2 (E) embryos at the 10-zsomite stage. The anterior is to the top. Arrowheads indicate the position of the midline. The bars indicate 10 μm. (F) The centrosome position relative to the midline. The position of 99 and 105 centrosomes were analyzed in the wild type embryos (N=3) and SAGFF73A;Gtuba2 embryos (N=3), respectively. No significant difference in the centrosome position was (not) observed between the wild type and SAGFF73A;Gtuba2 embryos (p = 0.27). Developing somites visualized with myoD in the wild type (G) and SAGFF73A;Gtuba2 (H) embryos at the 9-z10 somite stage. (I) The extent of the anterior-zposterior elongation was quantified by measuring the length (somite 1-z9) : width ratio of the myoD signal (CE index, L : W ratio in panel G) in the wild type embryos (N=6) and SAGFF73A;Gtuba2 embryos (N=5), respectively. NO significant difference in the CE index was observed between the wild type and SAGFF73A;Gtuba2 embryos (p = 0.19).