
|
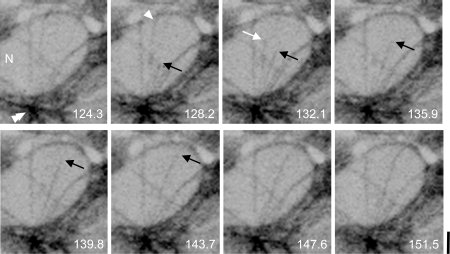
Fig. 2 Time lapse imaging of single microtubules (MTs). Serial images of a skin cell in the SAGFF73A;UAS:Gtuba2 larvae at 108 hours postfertilization (hpf). The green fluorescent protein (GFP) signal is shown in black. The MT that was present just before shrinking is indicated by the arrowhead. The shrinking end of the MT is indicated by the white arrow. The shrinking end is not evident in the next frame. The growing end of the other MT is indicated by the black arrow. The growth rate of this MT is in a range of 13.0–25.9 μm/min from t = 128.2 to 139.8, which is slightly faster than that observed in mammalian LLCPK-1 cells (Rusan et al.2001). The oval-shaped GFP-negative region (N) is the nucleus. The position of the putative MT-organizing center is indicated by the double arrowhead. The numbers in white indicate the time points in seconds. Scale bar = 2 μm.