
|
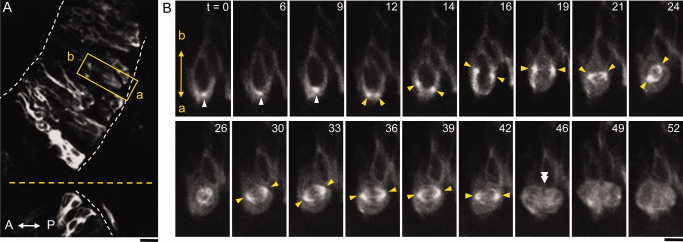
Fig. 3 Time lapse imaging of mitosis in the developing hindbrain. A: The dorsal view of the developing cerebellar region in the hspGGFF27A:UAS:Gtuba2 embryo at 54 hours postfertilization (hpf). The anterior is to the left. White dotted lines demarcate the developing cerebellum. The yellow dotted line indicates the midline. The division of the progenitor cell in the yellow box is monitored by time lapse imaging. The a and b indicate the apical and basal side of the cerebellum, respectively. Scale bars = 10 μm. B: Time lapse imaging of a progenitor cell in the yellow box in A. White arrowheads indicate the position of the centrosomes before separation. Yellow arrowheads indicate the separated centrosomes. The double arrowhead (t = 46) indicates the position of the cleavage furrow. The positions of the centrosomes were unclear at t = 26. The numbers in white indicate the time points in minutes. Scale bars = 10 μm in A; 5μm in B.