- Title
-
Temporal and spatial expression of CCN genes in zebrafish
- Authors
- Fernando, C.A., Conrad, P.A., Bartels, C.F., Marques, T., To, M., Balow, S.A., Nakamura, Y., and Warman, M.L.
- Source
- Full text @ Dev. Dyn.
|
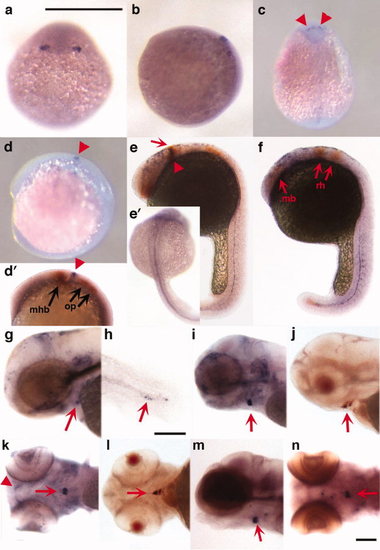
Expression pattern of zCyr61c-23 detected by in situ hybridization. a-n: Photographs of zebrafish embryos staged at 80% epiboly (a, dorsal view; b, lateral view), 5-8 somites (c,d,d′), and at 24 (e,e′,f), 48 (g,h), 96 (i-l), and 120 (m,n) hours postfertilization (hpf). Expression is observed in the lateral edges of the neural plate (a,b), the dorsal brain (c,d,d′,e, arrowheads), along the midline (e′,f), somites (f), pharyngeal cartilages (k, arrowhead), thyroid region (g,i-n, arrows) and in the developing hypurals (h, arrow). Double labeling of zCyr61c-23 (arrowhead) with pax2a (arrows) at five to eight somites and 24 hpf are shown in panel d´ and e, respectively. At the five to eight somite stage zCyr61-c23 is found between the midbrain-hindbrain boundary (mhb) and the otic placode (op, d′). By 24 hpf, zCyr61-c23 colocalizes with pax2a at the mhb (e, arrowhead) but is also seen extending from the anterior midbrain (mb) to the rhombomeres (rh, e, f) as evidenced by double labeling with epha4a (f, arrows). Double labeling of zCyr61-c23 with thyroglobulin shows colocalization in the thyroid region (j, l, arrows). Scale bars = 500 μm. EXPRESSION / LABELING:
|
|
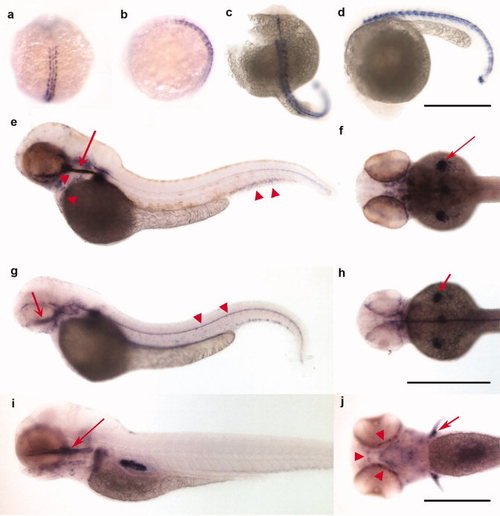
Expression pattern of zCTGF-c20 detected by in situ hybridization. a-j: Photographs of zebrafish embryos staged at 5- to 8-somites (a,b), and at 24 (c,d), 48 (e,f), 70 (g,h), and 96 (i,j) hpf. Expression is observed in adaxial cells of developing somites and in the floor plate at the 5-8 somite stage (a, dorsal view; b, lateral view) and at 24 hpf (c,d). Later during development, expression is seen along the notochord (e-h, arrowhead in g), heart and axial vasculature (e, arrowheads), ethmoid plate (e,g,i, arrows), pectoral fin buds (f,h, arrows), pectoral fins and developing mandibular arch (j, arrow and arrowheads, respectively). Scale bars = 500 μm for all figures except 96 hpf, where bar = 200 μm. EXPRESSION / LABELING:
|
|
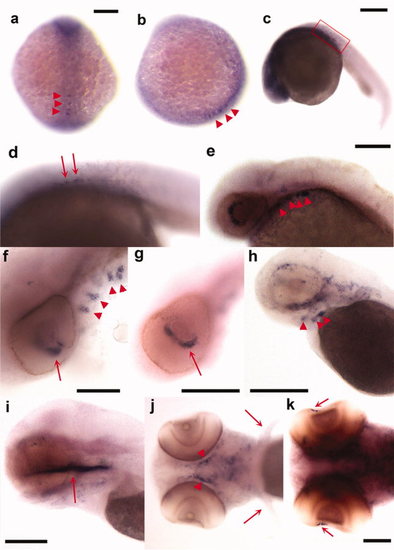
Expression pattern of zCTGF-c19 detected by in situ hybridization. a-k: Photographs of zebrafish embryos staged at 5- to 8-somites (a,b), and at 24 (c,d), 48 (e-g), 70 (h), 96 (i,j), and 120 (k) hours postfertilization (hpf). Expression is observed in the neural plate and the posterior region of embryo at the midline (arrowheads in a, dorsal view, b, lateral view,), and in the posterior notochord (arrows in d, [box in c is enlarged in d]), eye (e-g,k, arrows), pharyngeal cartilages (e,f,h,j, arrowheads), and ethmoid plate (i, arrow). In contrast to zCTGF-c20, no zCTGF-c19 expression is detected in the pectoral fins (j, arrow). Scale bars = 200 μm in a-c, 100 μm in f,i-k, 250 μm in e, 500 μm in g,h. EXPRESSION / LABELING:
|
|
Expression pattern of zCyr61-c5 detected by in situ hybridization. a-g: Photographs of zebrafish embryos staged at 24 (a,b), 48 (c), 55 (d,e), and 70 (f,g) hours postfertilization. Expression is observed in the somites (a,b) and otic vesicle (c,d,f,g, arrows). A sense probe (e), used as a negative control, demonstrates the specificity of zCyr61-c5 expression in the otic vesicle. Inserts in a and c show higher magnification views of somites (a) and otic vesicle (c). Scale bars = 250 μm in a,b, 200 μm in c,f, and 100μm in d,e,g. |
|
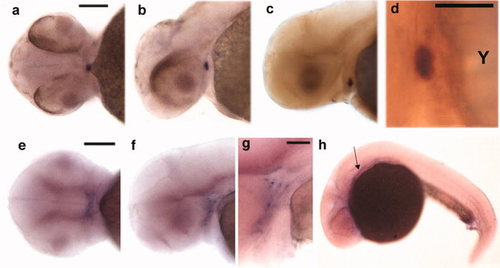
Expression patterns of zWisp1-c16, zWISP2-c23, and zCyr61-c8 detected by in situ hybridization. a-d: Photographs of 52 hours postfertilization (hpf) embryos demonstrating colocalization of zWisp1-c16 and thyroglobulin. zWisp1-c16 expression is indicated in blue (a-d) and thyroglobulin expression in red (c,d). Y, yolk. e-g: Photographs of zebrafish embryos staged at 70 hpf demonstrating zWISP2-c23 expression in the pharyngeal arches; g is at higher magnification and with a deeper focal view of the arches seen in f. h: Photograph of a 24 hpf embryo demonstrating zCyr61-c8 expression in prechordal plate (arrow). Scale bars = 100 μm in a-c and g, 50 μm in d -f. |


