
|
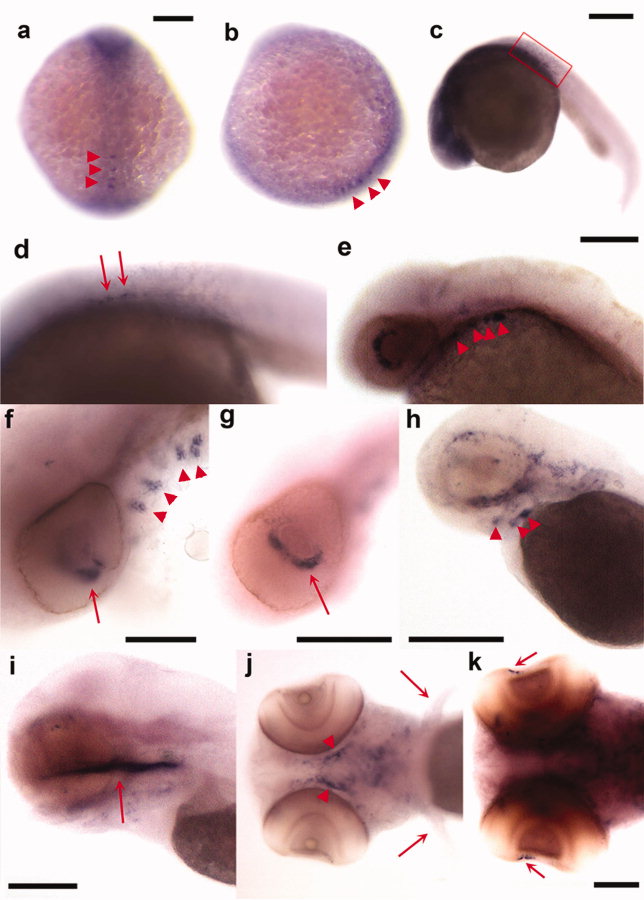
Fig. 4 Expression pattern of zCTGF-c19 detected by in situ hybridization. a-k: Photographs of zebrafish embryos staged at 5- to 8-somites (a,b), and at 24 (c,d), 48 (e-g), 70 (h), 96 (i,j), and 120 (k) hours postfertilization (hpf). Expression is observed in the neural plate and the posterior region of embryo at the midline (arrowheads in a, dorsal view, b, lateral view,), and in the posterior notochord (arrows in d, [box in c is enlarged in d]), eye (e-g,k, arrows), pharyngeal cartilages (e,f,h,j, arrowheads), and ethmoid plate (i, arrow). In contrast to zCTGF-c20, no zCTGF-c19 expression is detected in the pectoral fins (j, arrow). Scale bars = 200 μm in a-c, 100 μm in f,i-k, 250 μm in e, 500 μm in g,h.