
|
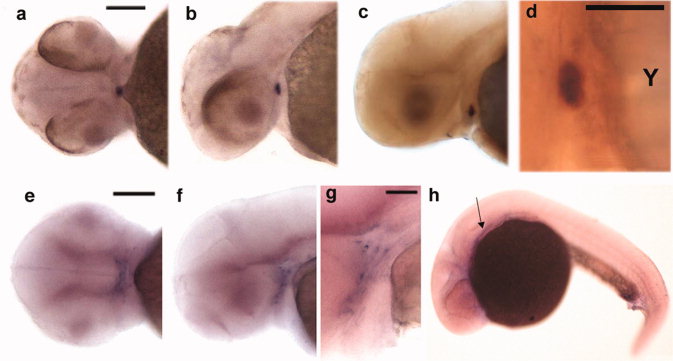
Fig. 6 Expression patterns of zWisp1-c16, zWISP2-c23, and zCyr61-c8 detected by in situ hybridization. a-d: Photographs of 52 hours postfertilization (hpf) embryos demonstrating colocalization of zWisp1-c16 and thyroglobulin. zWisp1-c16 expression is indicated in blue (a-d) and thyroglobulin expression in red (c,d). Y, yolk. e-g: Photographs of zebrafish embryos staged at 70 hpf demonstrating zWISP2-c23 expression in the pharyngeal arches; g is at higher magnification and with a deeper focal view of the arches seen in f. h: Photograph of a 24 hpf embryo demonstrating zCyr61-c8 expression in prechordal plate (arrow). Scale bars = 100 μm in a-c and g, 50 μm in d -f.