
Image
|
Figure Caption
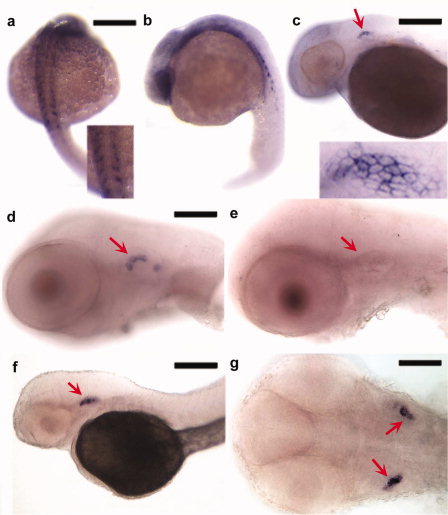
Fig. 5
Expression pattern of zCyr61-c5 detected by in situ hybridization. a-g: Photographs of zebrafish embryos staged at 24 (a,b), 48 (c), 55 (d,e), and 70 (f,g) hours postfertilization. Expression is observed in the somites (a,b) and otic vesicle (c,d,f,g, arrows). A sense probe (e), used as a negative control, demonstrates the specificity of zCyr61-c5 expression in the otic vesicle. Inserts in a and c show higher magnification views of somites (a) and otic vesicle (c). Scale bars = 250 μm in a,b, 200 μm in c,f, and 100μm in d,e,g.
Figure Data
Acknowledgments
This image is the copyrighted work of the attributed author or publisher, and
ZFIN has permission only to display this image to its users.
Additional permissions should be obtained from the applicable author or publisher of the image.
Full text @ Dev. Dyn.