
- Title
-
Critical early roles for col27a1a and col27a1b in zebrafish notochord morphogenesis, vertebral mineralization and post-embryonic axial growth
- Authors
- Christiansen, H.E., Lang, M.R., Pace, J.M., and Parichy, D.M.
- Source
- Full text @ PLoS One
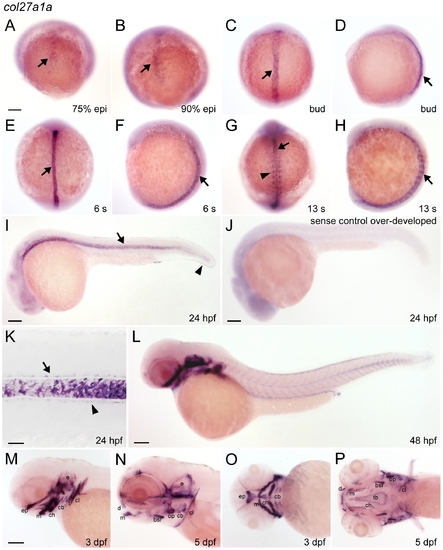
col27a1a is expressed in notochord and cartilage. (A–I) col27a1a was expressed in the notochord at early stages (black arrow), and (G) in the adaxial cells of the somites by 13 somite stage (arrowhead). At 24 hpf, expression was also observed in the (I) fin fold (black arrowhead) and in the (K) floor plate (black arrow) and hypochord (black arrowhead), surrounding the notochord. (J) Sense probe control was intentionally overexposed and revealed an absence of notochord staining. (L–P) Beginning at 48 hpf, strong expression of col27a1a was seen in the cartilage elements of the head and continued through 5 dpf, the latest time point analyzed. (M) Expression was also seen in the first forming tooth. Scale bar in K represents 20 μm. Scale bars in remaining images represent 100 μm. Scale bar in A applies to B–H. Scale bar in M applies to N–P. bsr, branchiostegal ray; cb, ceratobranchial arches; ch, ceratohyal; cl, cleithrum; d, dentary; e, ear; ep, ethmoid plate; m, maxilla; op, operculum; s, somites; t, tooth; tb, trabecule. EXPRESSION / LABELING:
|
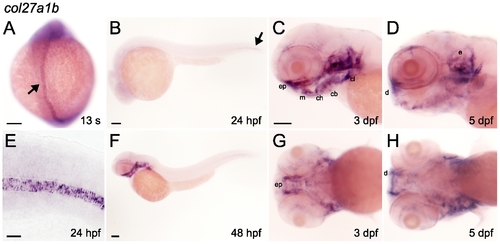
col27a1b is expressed in notochord and cartilage. col27a1b was expressed throughout the notochord at 13 somites (A) but by 24 hpf (B) was restricted to the distal tip of the tail (black arrow). (E) col27a1b expression in the notochord was restricted to the notochord itself and was not present in surrounding structures. (F) Expression of col27a1b in cartilage was observed beginning at 48hpf. Cartilage expression was also seen at 3 dpf (C, G) and 5 dpf (D, H), but it was diffuse and individual cartilage structures were not easily distinguished. Scale bar in E represents 20 μm. Scale bars in remaining images represent 100 μm. Scale bar in C applies to D, G, and H. cb, ceratobranchial arches; ch, ceratohyal; cl, cleithrum; d, dentary; e, ear; ep, ethmoid plate; m, maxilla. EXPRESSION / LABELING:
|
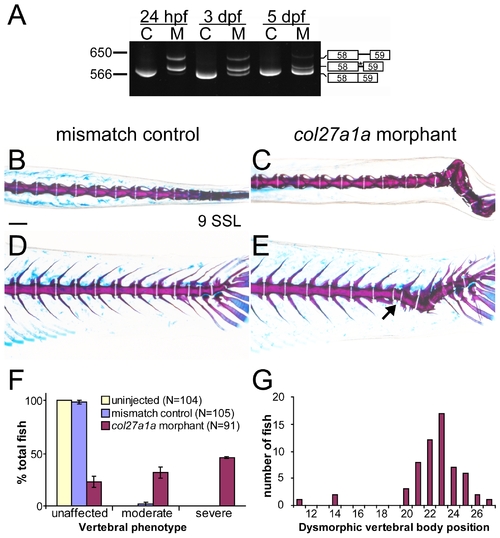
col27a1a morphants develop scoliosis and dysmorphic vertebrae. (A) Embryos injected with a SBMO targeting the exon 58 splice donor site of col27a1a showed abnormal splicing. Two abnormal splice forms including portions of intron 58 were generated. One splice form was predicted to generate a premature stop codon (asterisk). C, control; M, morphant. Dorsal and lateral views of col27a1a morphants (C, E) and mismatch control siblings (B, D) at ∼8.1–9.0 SSL (21 dpf) showed formation of scoliotic curves in the morphant vertebral column. Morphants were injected with a combined dose of 5 ng col27a1a SBMO+1 ng col27a1a TBMO. (F) By ∼8.1–9.0 SSL, 78% of col27a1a morphants had developed either moderate or severe vertebral defects. The mean from 3 clutches±standard error is shown. (E) Dysmorphic vertebrae without hemal or neural spines were also observed in the morphant vertebral column (black arrow). (G) These narrow, abnormal vertebrae were preferentially localized near the distal end of the tail. Vertebrae were counted beginning immediately distal to the 4 modified vertebrae of the Weberian apparatus. Scale bar in A represents 200 μm and applies to B–D. PHENOTYPE:
|
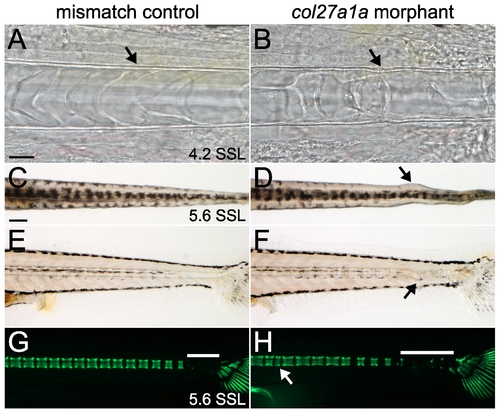
col27a1a is required for notochord development. Brightfield analysis of morphant (B) and mismatch control (A) notochords at ∼4.2 SSL (8 dpf) showed buckling of the notochord sheath. Dorsal (D) and lateral (F) views of col27a1a morphants at ∼5.6 SSL (14 dpf) show formation of notochord curves at the distal end of the tail. (C, E, G) Mismatch control siblings. (H) Calcein staining to visualize mineral showed abnormal vertebrae (white arrow) and decreased mineralization (white bar indicates unmineralized region). Scale bar in A represents 20 μm and applies to B. Scale bar in C represents 200 μm and applies to D–H. |

Protein and cellular accumulation in the col27a1a morphant notochord. Semithin sections (300 nm) of mismatch control (A) and col27a1a morphant (B) notochord were stained with Richardson′s stain for proteins at ∼4.5 SSL (10 dpf). The morphant notochord showed abnormal cellular clumping along the notochord sheath (white box and inset) and increased staining along membranes between notochord cells. (C–F) TEM analysis indicated that this staining was due to increased protein accumulation along membranes separating notochord cells. Scale bar in A represents 200 μm and applies to B. Scale bar in A inset represents 20 μm and applies to B inset. Scale bars in C and E represent 2 μm and apply to D and F, respectively. s, notochord sheath; sc, sheath cell; m, membrane. PHENOTYPE:
|
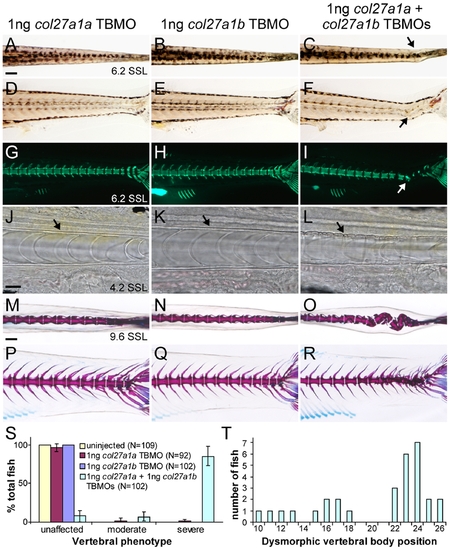
col27a1a and col27a1b interact genetically in the notochord and axial skeleton. Injection of col27a1a TBMO (A, D, G) and col27a1b TBMO (B, E, H) at low dosage did not result in a phenotype as seen at ∼6.2 SSL (14 dpf). (C, F) Simultaneous injection of col27a1a and col27a1b TBMOs at low dosage, however, resulted in notochord curves (black and white arrows). (I) Calcein staining to visualize mineral showed abnormal mineralization in double morphants. Brightfield analysis of col27a1a (J), col27a1b (K) and col27a1a and col27a1b double morphant (L) notochords at ∼4.2 SSL (8 dpf) showed severe buckling of the notochord sheath (black arrow) in double morphants. Dorsal and lateral views of col27a1a (M, P), col27a1b (N, Q) and double morphants (O, R) at ∼9.6–10 SSL (21 dpf) showed formation of scoliotic curves in the vertebral column of double morphants. (S) By ∼9.6–10 SSL, 92% of col27a1a and col27a1b double morphants had developed either moderate or severe vertebral defects, with the majority being very severe. The mean from 3 clutches±standard error is shown. (T) Dysmorphic vertebrae without hemal or neural spines were also observed in double morphants. These additional dysmorphic vertebrae were spread throughout the vertebral column but preferentially localized to a region near the distal end of the tail. Scale bars in A and M represent 200 μm and apply to B–I and N–R, respectively. Scale bar in J represents 20 μm and applies to K and L. PHENOTYPE:
|

Unillustrated author statements EXPRESSION / LABELING:
|