
|
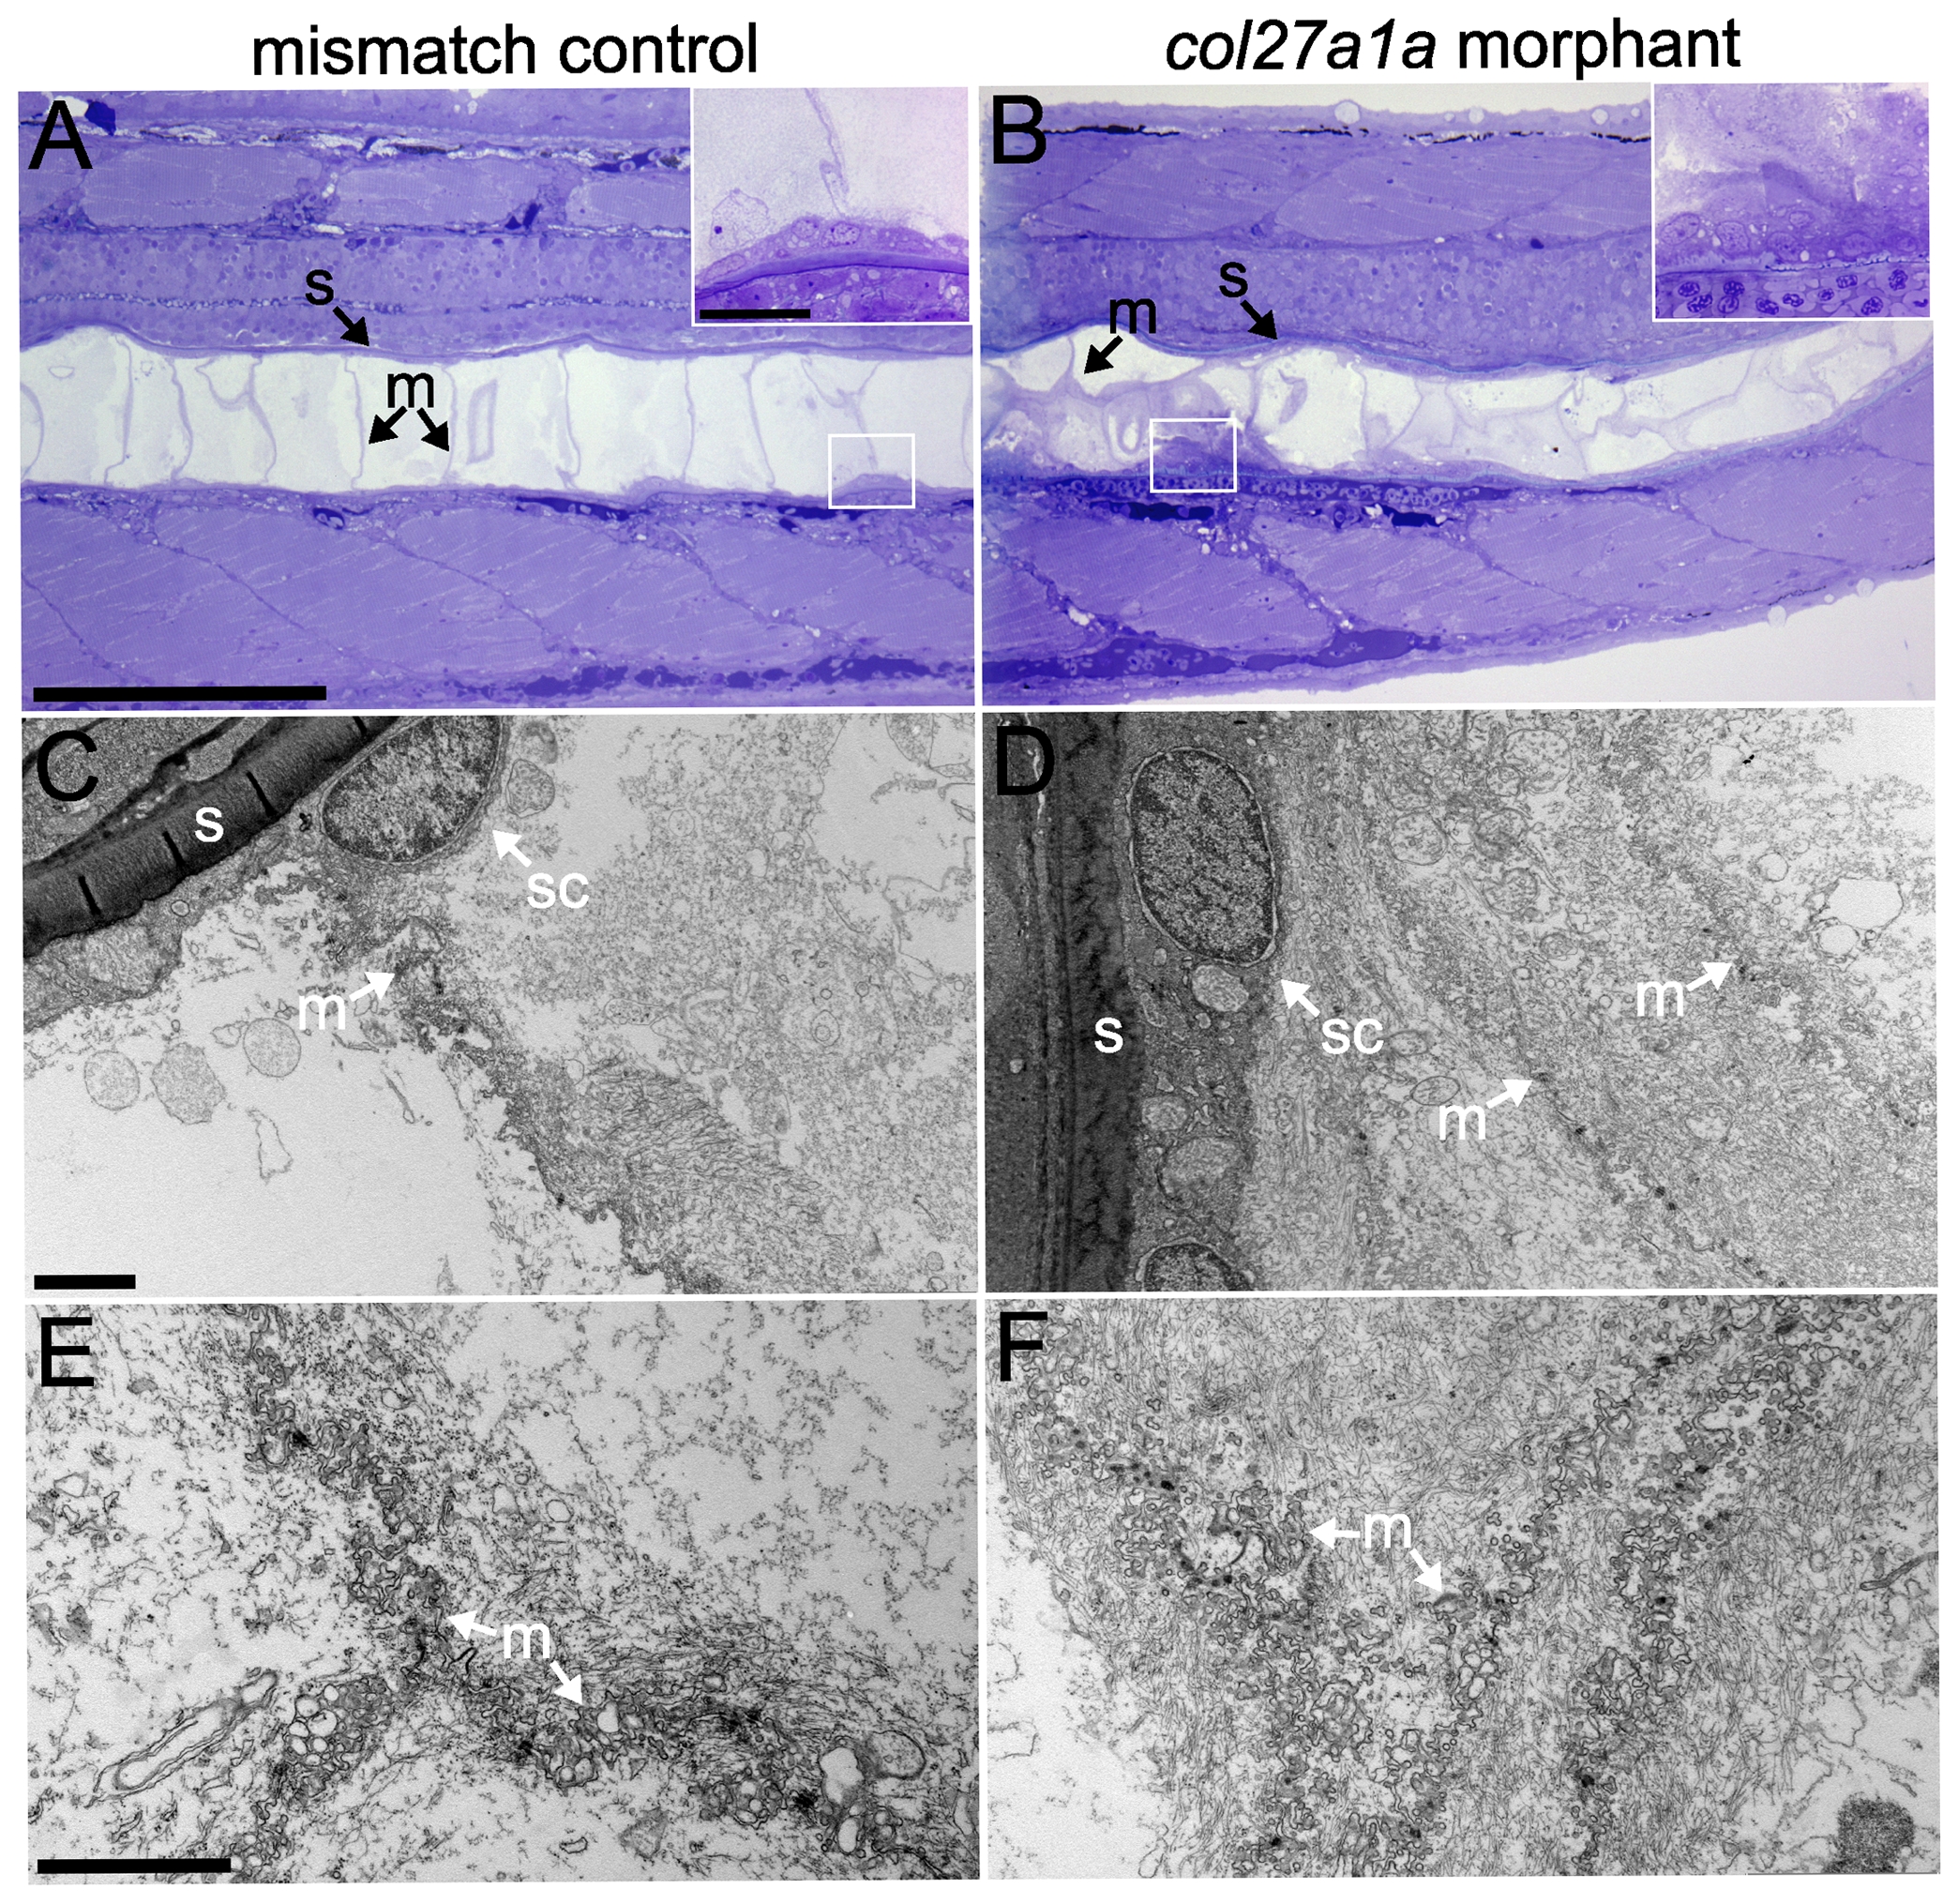
Fig. 6 Protein and cellular accumulation in the col27a1a morphant notochord.
Semithin sections (300 nm) of mismatch control (A) and col27a1a morphant (B) notochord were stained with Richardson′s stain for proteins at ∼4.5 SSL (10 dpf). The morphant notochord showed abnormal cellular clumping along the notochord sheath (white box and inset) and increased staining along membranes between notochord cells. (C–F) TEM analysis indicated that this staining was due to increased protein accumulation along membranes separating notochord cells. Scale bar in A represents 200 μm and applies to B. Scale bar in A inset represents 20 μm and applies to B inset. Scale bars in C and E represent 2 μm and apply to D and F, respectively. s, notochord sheath; sc, sheath cell; m, membrane.