- Title
-
Emx3 is required for the differentiation of dorsal telencephalic neurons
- Authors
- Viktorin, G., Chiuchitu, C., Rissler, M., Varga, Z.M., and Westerfield, M.
- Source
- Full text @ Dev. Dyn.
|
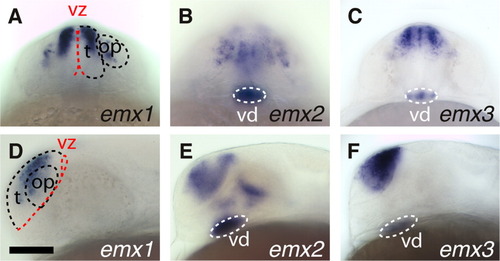
emx1, emx2, and emx3 mRNA is expressed in overlapping domains in the dorsal telencephalon. A-C: emx1 (A) is expressed exclusively in the telencephalon (t) mantle, away from the ventricular zone, whereas emx2 (B) and emx3 (C) are expressed in both the ventricular zone (vz, red dashed line) and mantle. vd (white dashed lines) indicates the ventral diencephalic expression domain of emx2 and emx3. emx1, emx2, and emx3 are also expressed in few cells of the olfactory placode (op in A,D). D-F: Side views are included for orientation. The red dashed line in D outlines the fissure separating telencephalon (t) and diencephalon; black dashed lines outline the telencephalon and olfactory placode in A,D. A-C: Frontal views. D-F: Side views. Scale bar = 50 μm. EXPRESSION / LABELING:
|
|
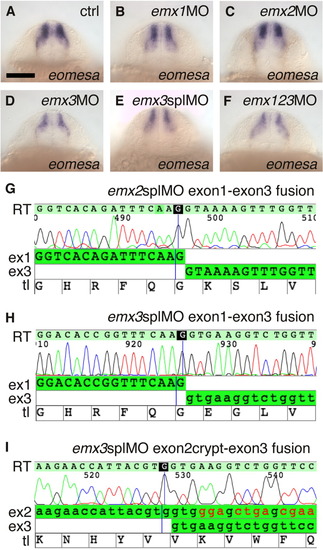
Only emx3 and emx1 regulate expression of eomesa. A-E: Injection of emx3 morpholino antisense oligonucleotides (MO; D,E), to a lesser extent emx1MO (B), but not emx2MO (C), leads to reduced expression of eomesa compared with control embryos (A). F: The emx3 morpholino phenotype is not enhanced when emx1MO and emx2MO are coinjected. emx3 splice morpholinos (E) give rise to the same phenotype as translation blocking morpholinos (D), and lead to aberrantly spliced mRNA (H,I), which together confirms specificity of emx3 morpholino phenotypes. G-I: Reverse transcriptase-polymerase chain reaction (RT-PCR) of RNA from embryos injected with emx2 and emx3 splice morpholinos that target exon 2 leads to aberrantly spliced mRNAs. Exon1 is fused to exon3 of emx2 (G) and emx3 (H), respectively. Alternatively, the third exon of emx3 is spliced to a cryptic splice site within exon 2 that leads to an in-frame deletion of parts of helix 2 of the homeodomain (I). A-F: Frontal views of 24 hr embryos, dorsal to the top. Scale bar = 100 μm. |
|
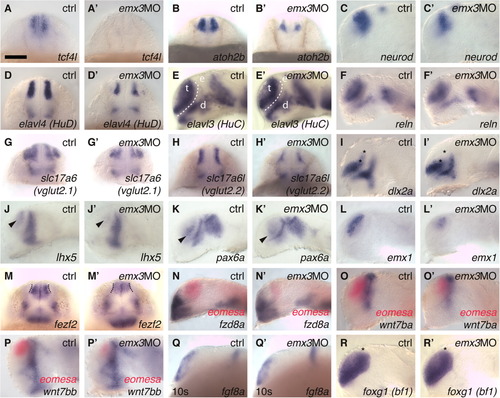
A-R: emx3 morpholino injection specifically reduces expression of dorsal telencephalic marker genes. A-D′,G-N′: Expression of tcf4l (A-A′) in the dorsal telencephalon is lost, and expression domains of atoh2b (B-B′), neurod (C-C′), elavl4 (D-D′), slc17a6 (G-G′) slc17a6l (H-H′), dlx2a (I-I′, only the domain between asterisks), lhx5 (J-J′), pax6a (K-K′), emx1 (L-L′), are reduced in emx3 morpholino antisense oligonucleotides (MO) injected embryos compared with control embryos. More broadly expressed neuronal differentiation markers elavl3 (E-E′) and reln (F-F′) show little or no apparent difference between controls and emx3MO injected embryos. fezf2 (M-M′) expression is reduced only in the more intense expression domain adjacent to the olfactory placodes (dotted lines), but unchanged in the ventricular zone. Ventral telencephalic expression domains (dlx2a, I-I′, fzd8a, N-N′; fgf8a, Q-Q′; foxg1, R-R′) are unaffected by emx3MO injections, as are diencephalic expression domains (C-K′, M-Q′). Shape and size of the telencephalon appears unaltered in emx3MO embryos compared with control embryos, as indicated for example by elavl3 (E-E′; t, telencephalon, outlined by white dotted lines; e, epiphysis; d, diencephalon), and foxg1 (R-R′) expression. Commonly used previous gene names of recently renamed genes are given in parentheses. A-B′, D-D′, G-H′, M-M′: Frontal views, dorsal to the top. C-C′, E-F′, I-L′, N-R′: Side views, dorsal to the top, rostral to the left; eyes removed except in Q-Q′. A-P′, R-R′: At 24 hr, (Q-Q′) 10-somite stage (14 hr). Scale bar = 100 ′m. EXPRESSION / LABELING:
PHENOTYPE:
|
|
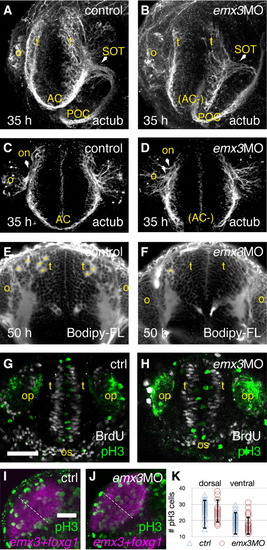
Embryos injected with emx3 morpholino antisense oligonucleotides (MO) form abnormal axon tracts, lack olfactory glomeruli, and have normal cell division patterns. A-D: Acetylated tubulin labeling of axons; 35 hr; emx3 knockdown embryos lack anterior commissure (AC in B,D). The supraoptic tract (SOT) is present but not fasciculated (arrows in A,B). Similarly, the olfactory nerve (on) that extends from the developing olfactory organ (o) to the dorsal telencephalon (t) is defasciculated in emx3 knockdown embryos (arrows in C,D). E,F: emx3MO injected embryos have fewer presumptive olfactory glomeruli (yellow asterisks), visualized by Bodipy-ceramide staining. As in (G,H), the characteristic morphology of the ventricular zone appears broader in emx3MO embryos. G,H: Five minutes of 5-bromo-2-deoxyuridine (BrdU, white) incubation labels cells in S-phase. In control- and emx3MO-injected embryos at 24 hr, BrdU labeled cells are located in a 3-4 cell-wide region close to the ventricular zone. Mitotic cells, labeled by anti-phosphorylated histone H3 (pH3, green), are located on the ventricular side of the telencephalon in both tp53MO and emx3MO injected embryos. I-K: The number (K) and dorsoventral distribution (I-K) of pH3 positive cells in the medial telencephalic ventricular zone is the same in control (I,K) and emx3MO injected embryos (J,K). I,J: Projections of the side view confocal stack used for cell counts in K; the dotted line indicates the border between dorsal and ventral telencephalon, error bars denote SEM. Anterior is to the left, dorsal to the top. Confocal projections of oblique (A,B) straight (C-H) frontal views, dorsal to the top. os, optic stalk; POC, postoptic commissure. Scale bars = 50 μm. |
|
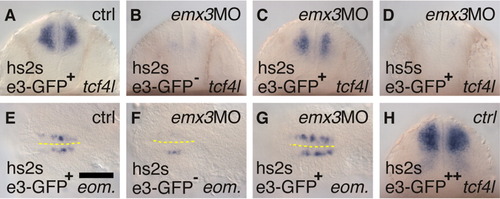
A-H: Heat shock-induced Emx3 protein partially rescues emx3 morpholino antisense oligonucleotides (MO) -induced knockdown, whereas excessive Emx3 dorsalizes the telencephalon. A-C,E-G: Low levels of Emx3-myc-GFP expression (e3-GFP+), induced by heat shock at the 1- or 2-somite stages (10.5 hr, hs2s), 20-30 min after the onset of endogenous emx3 mRNA expression at bud stage, rescues the emx3MO-induced down regulation of tcf4l (A-C) and eomesa (eom., E-G). Later heat shock, between the 5- and 7-somite stages (11.5 hr, hs5s), does not rescue the phenotype (B,D). Higher levels of GFP expression after heat shock (e3-GFP++), indicating higher levels of Emx3 activity, lead to dorsalized telencephalon as assessed by ventrally expanded expression of tcf4l (A,H). A-D,H: Frontal views, dorsal to the top, 25 hr; (E-G) Dorsal view, rostral to the left, 12-somite stage (15 hr). Scale bar = 100 μm. EXPRESSION / LABELING:
PHENOTYPE:
|
|
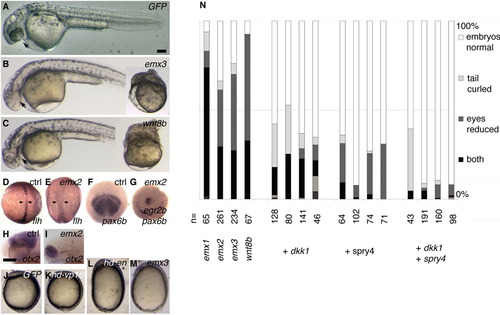
A-N: Overexpression of emx1, emx2, or emx3 mRNA, as well as emx3-homeodomain-en mRNA, dorsalizes and posteriorizes embryos. A-I,J,M: Injection of emx2 mRNA (E,G,I), emx3 mRNA (B,M), and wnt8b mRNA (C) produces embryos with posteriorized central nervous systems (loss of eyes in B,C,I loss of pax6b expression and anterior shift of egr2b expression in G; loss of otx2 expression except for an abnormally anterior expression domain in I), and dorsalization phenotypes (curly tail in B,C, insets, broadened flh-expressing notochord in E, abnormally egg-shaped embryos in E,M). J-M: Dorsalization effects are mimicked by emx3hd-en (L), but not emx3hd-VP16 (K) fusion proteins, indicating that emx3 might act as a repressor. N: Quantification of phenotypes caused by emx and wnt8b mRNA injection and their rescue by coinjection of the Wnt/beta-catenin pathway inhibitor dkk1 and Fgf pathway inhibitor spry4, suggesting that excessive emx mRNA in the early embryo potentiates the effects of these signaling pathways. A-C,H-M: Side views, dorsal to the top, rostral to the left; (D,E) Dorsal views, animal pole to the top; (F,G) Animal pole views, dorsal to the bottom. (A-C) 35 hr; (H,I) 30 hr; (D-G, J-M) bud stage. Scale bars = 100 μm. |
|
emx3 is required cell-autonomously for atoh2b and emx1 expression. A,B: tp53 morpholino antisense oligonucleotides (MO) and Alexa555-dextran-injected donor cells (A,B, yellow dotted line), but not emx3MO plus tp53MO injected host cells, express atoh2b (B) in chimeric embryos. tp53MO cells were co-injected with Alexa555-dextran and transplanted into emx3MO injected host embryos. C: Ectopic expression of emx3:GFP fusion (brown), under the control of hsp70l promoter, induces ectopic expression of emx1 (blue) in a cell-autonomous manner. White dotted lines outline olfactory placode borders and telencephalon midline. op, olfactory placode; t, telencephalon. (A,B) Frontal views, dorsal to the top; (C) dorsal view, rostral to the left; (A,B) 24 hr, (C) 20 hr. Scale bar = 50 μm. |

Unillustrated author statements |

