
- Title
-
Myofibrillogenesis in the Developing Zebrafish Heart: A Functional Study of tnnt2
- Authors
- Huang, W., Zhang, R., and Xu, X.
- Source
- Full text @ Dev. Biol.
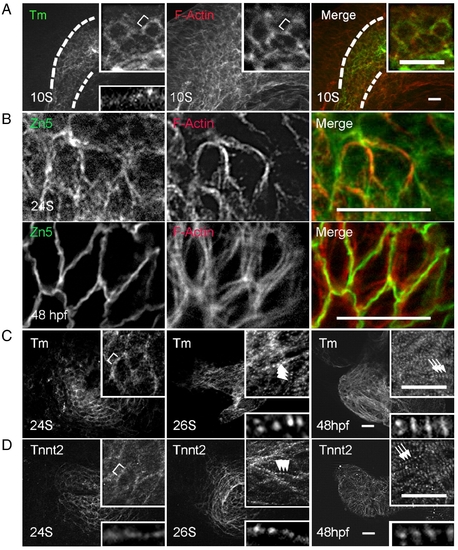
Assembly of thin filaments in the embryonic zebrafish heart. (A) Shown are images of 10 S embryos after two-color immunostaining to label Tm (green) and F-actin (red). Tm and F-actin networks are co-localized within the cardiac progenitor cells (outlined by dashed lines), which are labeled by Tm staining. The F-actin network also extends to the neighboring cells beyond the cardiac progenitor cells. (B) Shown are images of two-color immunostaining using the Zn5 antibody to label cell membrane (green) and phalloidin to label thin filaments (red). The thin filament network in the ventricle appears to associate with the cell membrane at both 24 S and 48 hpf. (C and D) Shown are images of 24 S, 26 S, and 48 hpf embryos after immunostaining using either anti-Tm (C) or anti-tnnt2 antibody (D). Both anti-Tm and anti-tnnt2 antibodies revealed a continuous filament network at 24 S, which becomes striated at 26 S, and lateral growth forming mature thin filaments at 48 hpf. Insets in (A, C, D) are of the same image at higher magnification. Insets at top are of networks, and insets at bottom are of myofibrils. Brackets, continuous thin filaments. Arrowheads, periodic dots of thin filaments after striation. Arrows, mature thin filaments after lateral growth. Scale bar = 20 μm. |
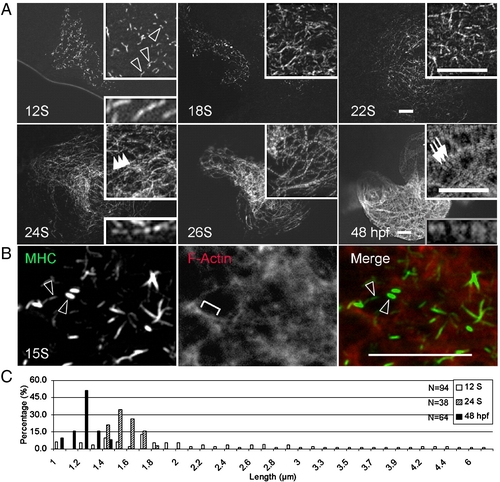
Assembly of thick filaments in the embryonic zebrafish heart. (A) Thick filaments in embryos at different developmental stages as revealed by immunostaining for myosin heavy chain (MHC) using the F59 antibody. (B) Shown is the two-color immunostaining of 15 S embryos to reveal myosin filaments with the F59 antibody (green) and the F-actin filament network by phalloidin (red). Myosin rodlets and actin filaments do not overlap at this stage. (C) The distribution of lengths of myosin rodlets at 12 S and 24 S, and A-bands at 48 hpf. The myosin rodlets are of variable length until 24 S, when they turn uniform and become shorter at 48 hpf. The x-axis represents the length of myosin rodlets, while the y-axis represents the percentage of myosin rodlets with a particular length. N, total number of myosin rodlets quantified at each stage. Open arrowheads, myosin rodlets of variable length. Arrowheads, myosin rodlets of uniform length after assembling into the thin filament network. Arrows, mature A-bands. Brackets, continuous thin filaments. Insets are same images at higher magnification. Scale bar = 20 μm. |
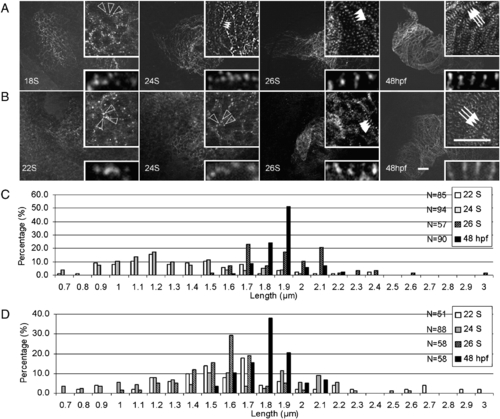
Assembly of α-actinin and myomesin in the embryonic zebrafish heart. Embryos at different stages were stained for α-actinin (A) and myomesin (B) to indicate assembly of the Z-disc and M-line. Before 22 S, α-actinin appears as irregular dot in the cell periphery region. The α-actinin dots become periodic at 24 S and the distance between them expands at 26 S. In contrast, myomesin dots are irregular before 24 S, and become periodic at 26 S. At 48 hpf, both α-actinin and myomesin dots undergo lateral growth to form the mature Z-disc and M-line. Open arrowheads, random dots of α-actinin (A) or myomesin (B). Indented arrowheads, α-actinin dots having shorter periodicity. Arrowheads, α-actinin dots (A) or myomesin (B) having longer periodicity. Arrows, mature Z-discs (A) or M-lines (B) after lateral growth. Insets are same images at higher magnification. Scale bar = 20 μm. Distribution of the distance between two neighboring α-actinin or myomesin dots at different developmental stages is illustrated in C and D, respectively. The x-axis represents the length of sarcomere unit, while the y-axis shows the percentage of sarcomere units with a particular length. N, total number of sarcomere units quantified at each stage. |
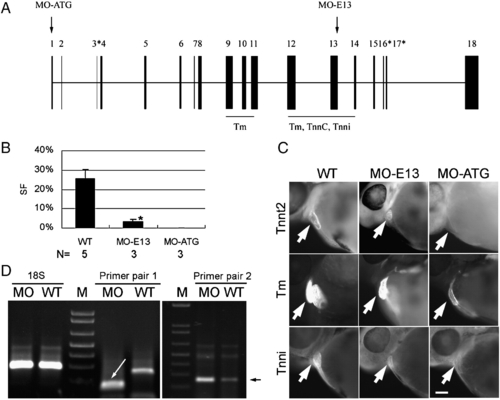
MO-ATG depletes full-length tnnt2, while MO-E13 generates truncated tnnt2. (A) Schematic illustration of the zebrafish tnnt2 gene. Exons are indicated by black boxes, with the alternatively spliced exons indicated by asterisks. The exons that encode an N-terminal Tm binding domain and a C-terminal Tm/tnnc/tnni binding domain are underlined (Watkins et al., 1995). The sites targeted by the MOs are indicated with arrows. For more detailed annotation, see Supplemental Table S1. (B) Quantification of cardiac contractility in WT and morphants. Shown are mean ± s.d. of the shortening fraction of ventricular chambers. In contrast to a silent heart in MO-ATG morphants, weak contractility still exists in MO-E13 morphants. For video, see the Supplemental Movies. *p < 0.01, if compared with WT. N, number of hearts quantified. (C) Shown are embryos of WT, morphants of MO-ATG or MO-E13 at 48 hpf after immunostaining to reveal tnnt2, Tm, and tnni, respectively. Both tnnt2 and tnni are severely reduced in MO-ATG morphants while Tm is weakly reduced. tnnt2 is weakly reduced in the MO-E13 morphant while Tm and Tnni remain unchanged. Arrows indicate the ventricular chambers. Scale bar = 20 μm. (D) RT-PCR analysis of tnnt2 transcripts in MO-E13 morphants at 48 hpf. Primer pair 1 reveals a shorter product in the MO-E13 morphant (indicated by a white arrow), indicating an exon-skipping event that links exon 12 to exon 14. Primer pair 2 targeting at exon 8 detected an increased level of tnnt2 mRNA in MO-E13 morphants. The specific PCR product that is amplified by primer pair 2 is indicated by a black arrow. A primer pair targeting 18 S rDNA was used to optimize the starting amount of PCR template. |
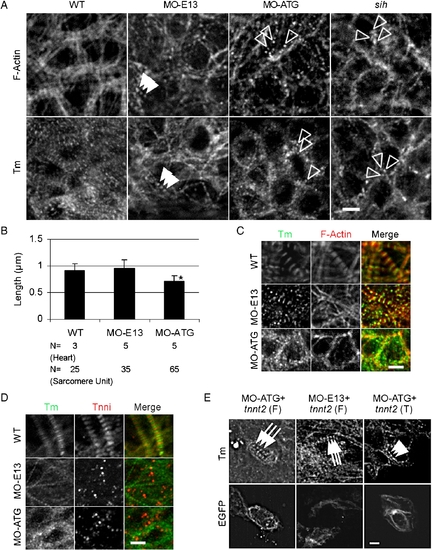
Thin filament striation was disrupted in MO-ATG morphants, but not in MO-E13 morphants. (A) Shown are images of 48 hpf embryos after immunostaining using either Tm antibody or phalloidin staining to reveal the F-actin network. Irregular actin and Tm dots were detected in MO-ATG morphants and sih mutants, while periodic dots of actin and Tm dots were detected in MO-E13 morphants. Open arrowheads, random dots of F-actin or Tm. Arrowheads, periodic F-actin or Tm dots. (B) Quantification of the length of F-actin filaments in 48 hpf embryos. Shown are mean ± s.d. *p < 0.01, if compared with WT. N, number of hearts or sarcomere units quantified. (C) Shown are images of 48 hpf embryos after two-color immunostaining to reveal Tm (green) and actin filament (red). Association of Tm and F-actin was disrupted in MO-ATG morphants, but not in MO-E13 morphants. (D) Shown are images of 48 hpf embryos after two-color immunostaining for Tm (green) and Tnni (red). Assembly of Tnni into thin filaments and sarcomeres was disrupted in both morphants. (E) Shown in the top panels are images of 48 hpf embryos after immunostaining with CH1 antibody to reveal sarcomere assembly. Shown in the lower panels are individual cardiomyocytes with EGFP signal, indicating the expression of ectopic tnnt2 transcripts. Injection of full-length tnnt2 in either MO-ATG or MO-E13 morphants completely rescued sarcomere assembly, while injection of C-terminal truncated tnnt2 in MO-ATG morphants partially rescued sarcomere assembly to achieve a striated pattern. Arrows, mature sarcomeres. Arrowheads, partially rescued sarcomeres with striated pattern. Scale bar = 5 μm. |
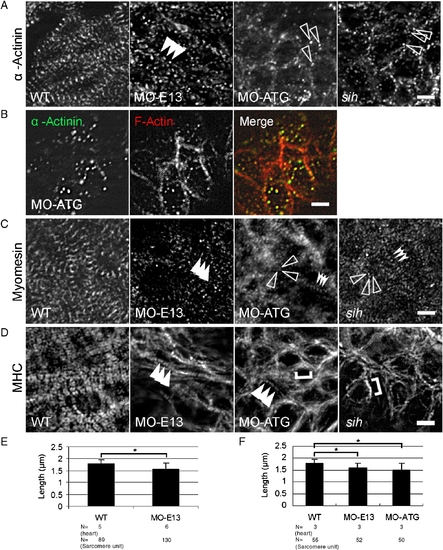
Disrupted assembly of the Z-disc, thick filaments and the M-line in morphants. (A) Shown are images of 48 hpf embryos after immunostaining to reveal Z-disc assembly using α-actinin antibody. Irregular dots were detected in both MO-ATG morphants and sih mutants, whereas periodic dots were detected in MO-E13 morphants. Arrowheads, periodic α-actinin dots. Open arrowheads, irregular α-actinin dots. (B) Shown are images of MO-ATG morphant embryos at the 48 hpf stage after two-color immunostaining to reveal α-actinin (green) and actin filament (red). α-actinin dots and the F-actin network are still co-localized. (C) Shown are images of 48 hpf embryos after immunostaining to reveal M-line assembly using the anti-myomesin antibody. Arrowheads, striated M-lines. Open arrowheads, irregular myomesin dots. Indented arrowheads, periodic myomesin dots separated by a short distance. (D) Shown are images of 48 hpf embryos after immunostaining to reveal thick filaments using the F59 antibody. Arrowheads, striated thick filaments. Brackets, continuous thick filaments. (E) Quantification of the distance between two neighboring α-actinin dots in ventricles from WT and MO-E13 morphants at 48 hpf. Shown are mean ± s.d. N, number of heart and sarcomere units quantified. (F) Quantification of the distance between two periodically neighboring myomesin dots in ventricles from WT and morphants at 48 hpf. Shown are mean ± s.d. N, number of heart and sarcomere units quantified. *p < 0.01. Scale bar = 5 μm. |
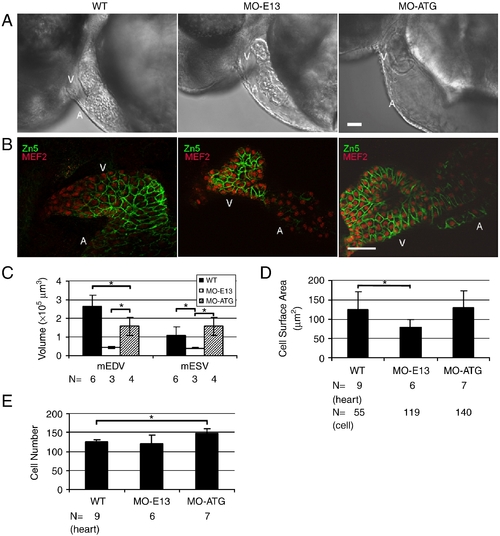
Injection of MO-ATG and MO-E13 results in different changes in the size and number of ventricular cardiomyocytes. (A) Shown are lateral images of hearts in live WT and morphant embryos, 48 hpf. Ventricle in MO-E13 morphants appears smaller than WT. V, ventricle. A, atrium. (B) Shown are images of 48 hpf embryos after two-color immunostaining using Zn5 to reveal cell borders of cardiomyocytes (green) and mef2c to reveal nuclei of cardiomyocytes (red). V, ventricle. A, atrium. (C) Quantification of end-systolic and diastolic ventricular volume (mESV and mEDV, respectively) at 48 hpf. Shown are mean ± s.d. N, number of hearts quantified. (D) Quantification of the surface area of individual cardiomyocytes from a ventricular chamber at 48 hpf. Shown are mean ± s.d. N, number of hearts and cells quantified. (E) Quantification of ventricular cardiomyocyte number at 48 hpf. N, number of hearts quantified. *p < 0.01. Scale bar = 40 μm. |
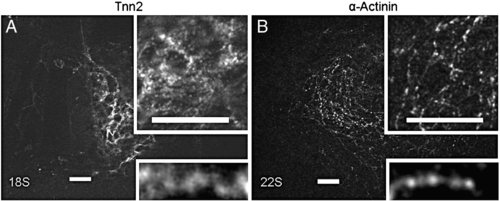
Immunostaining for tnnt2 (A) and α-actinin (B) in the WT heart at early stages. At 18 S, tnnt2 appears as dotted pattern that associates with the thin filament network in perimembrane region. At 22 S, α-actinin dots start to be periodic, but show a shorter distance between two neighboring α-actinin dots than at 26 S. Insets are of the same image of higher magnification to reveal networks (at top), and a myofibril (at bottom). Scale bar = 20 μm. |
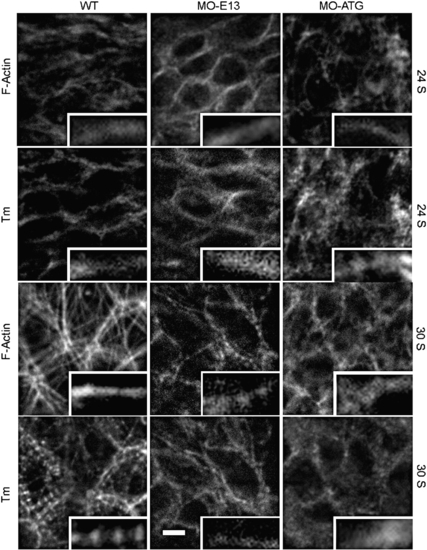
Thin filament assembly in morphants at an early stage revealed by immunostaining for F-actin and Tm. Assembly of continuous thin filaments was not affected in either MO-ATG or MO-E13 morphants at 24 S. Thin filaments remained as continuous filaments at 30 S in MO-ATG morphants while both F-actin and Tm exhibit a striated pattern in the WT control and MO-E13 morphants. Scale bar = 5 μm. |
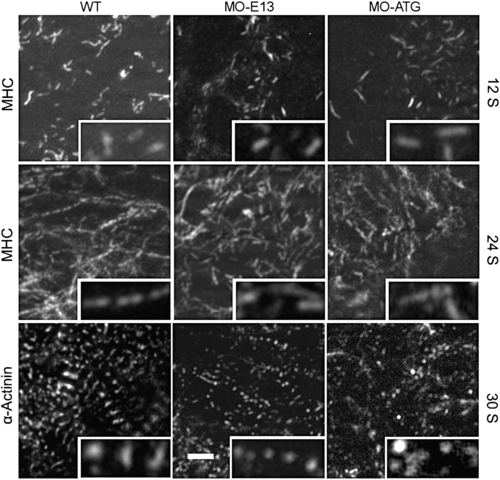
Thick filament and α-actinin assembly in morphants at early stages revealed by immunostaining for MHC and α-actinin, respectively. Myosin rodlets with variable lengths are assembled normally in both morphants at 12 S. However, they fail to be striated and do not integrate into the thin filament network at 24 S, as does the WT control. Irregular α-actinin dots were detected in MO-ATG morphants at 30 S, while periodic dots can be detected in both the WT control and MO-E13 morphants. Scale bar = 5 μm. |
Reprinted from Developmental Biology, 331(2), Huang, W., Zhang, R., and Xu, X., Myofibrillogenesis in the Developing Zebrafish Heart: A Functional Study of tnnt2, 237-249, Copyright (2009) with permission from Elsevier. Full text @ Dev. Biol.