
|
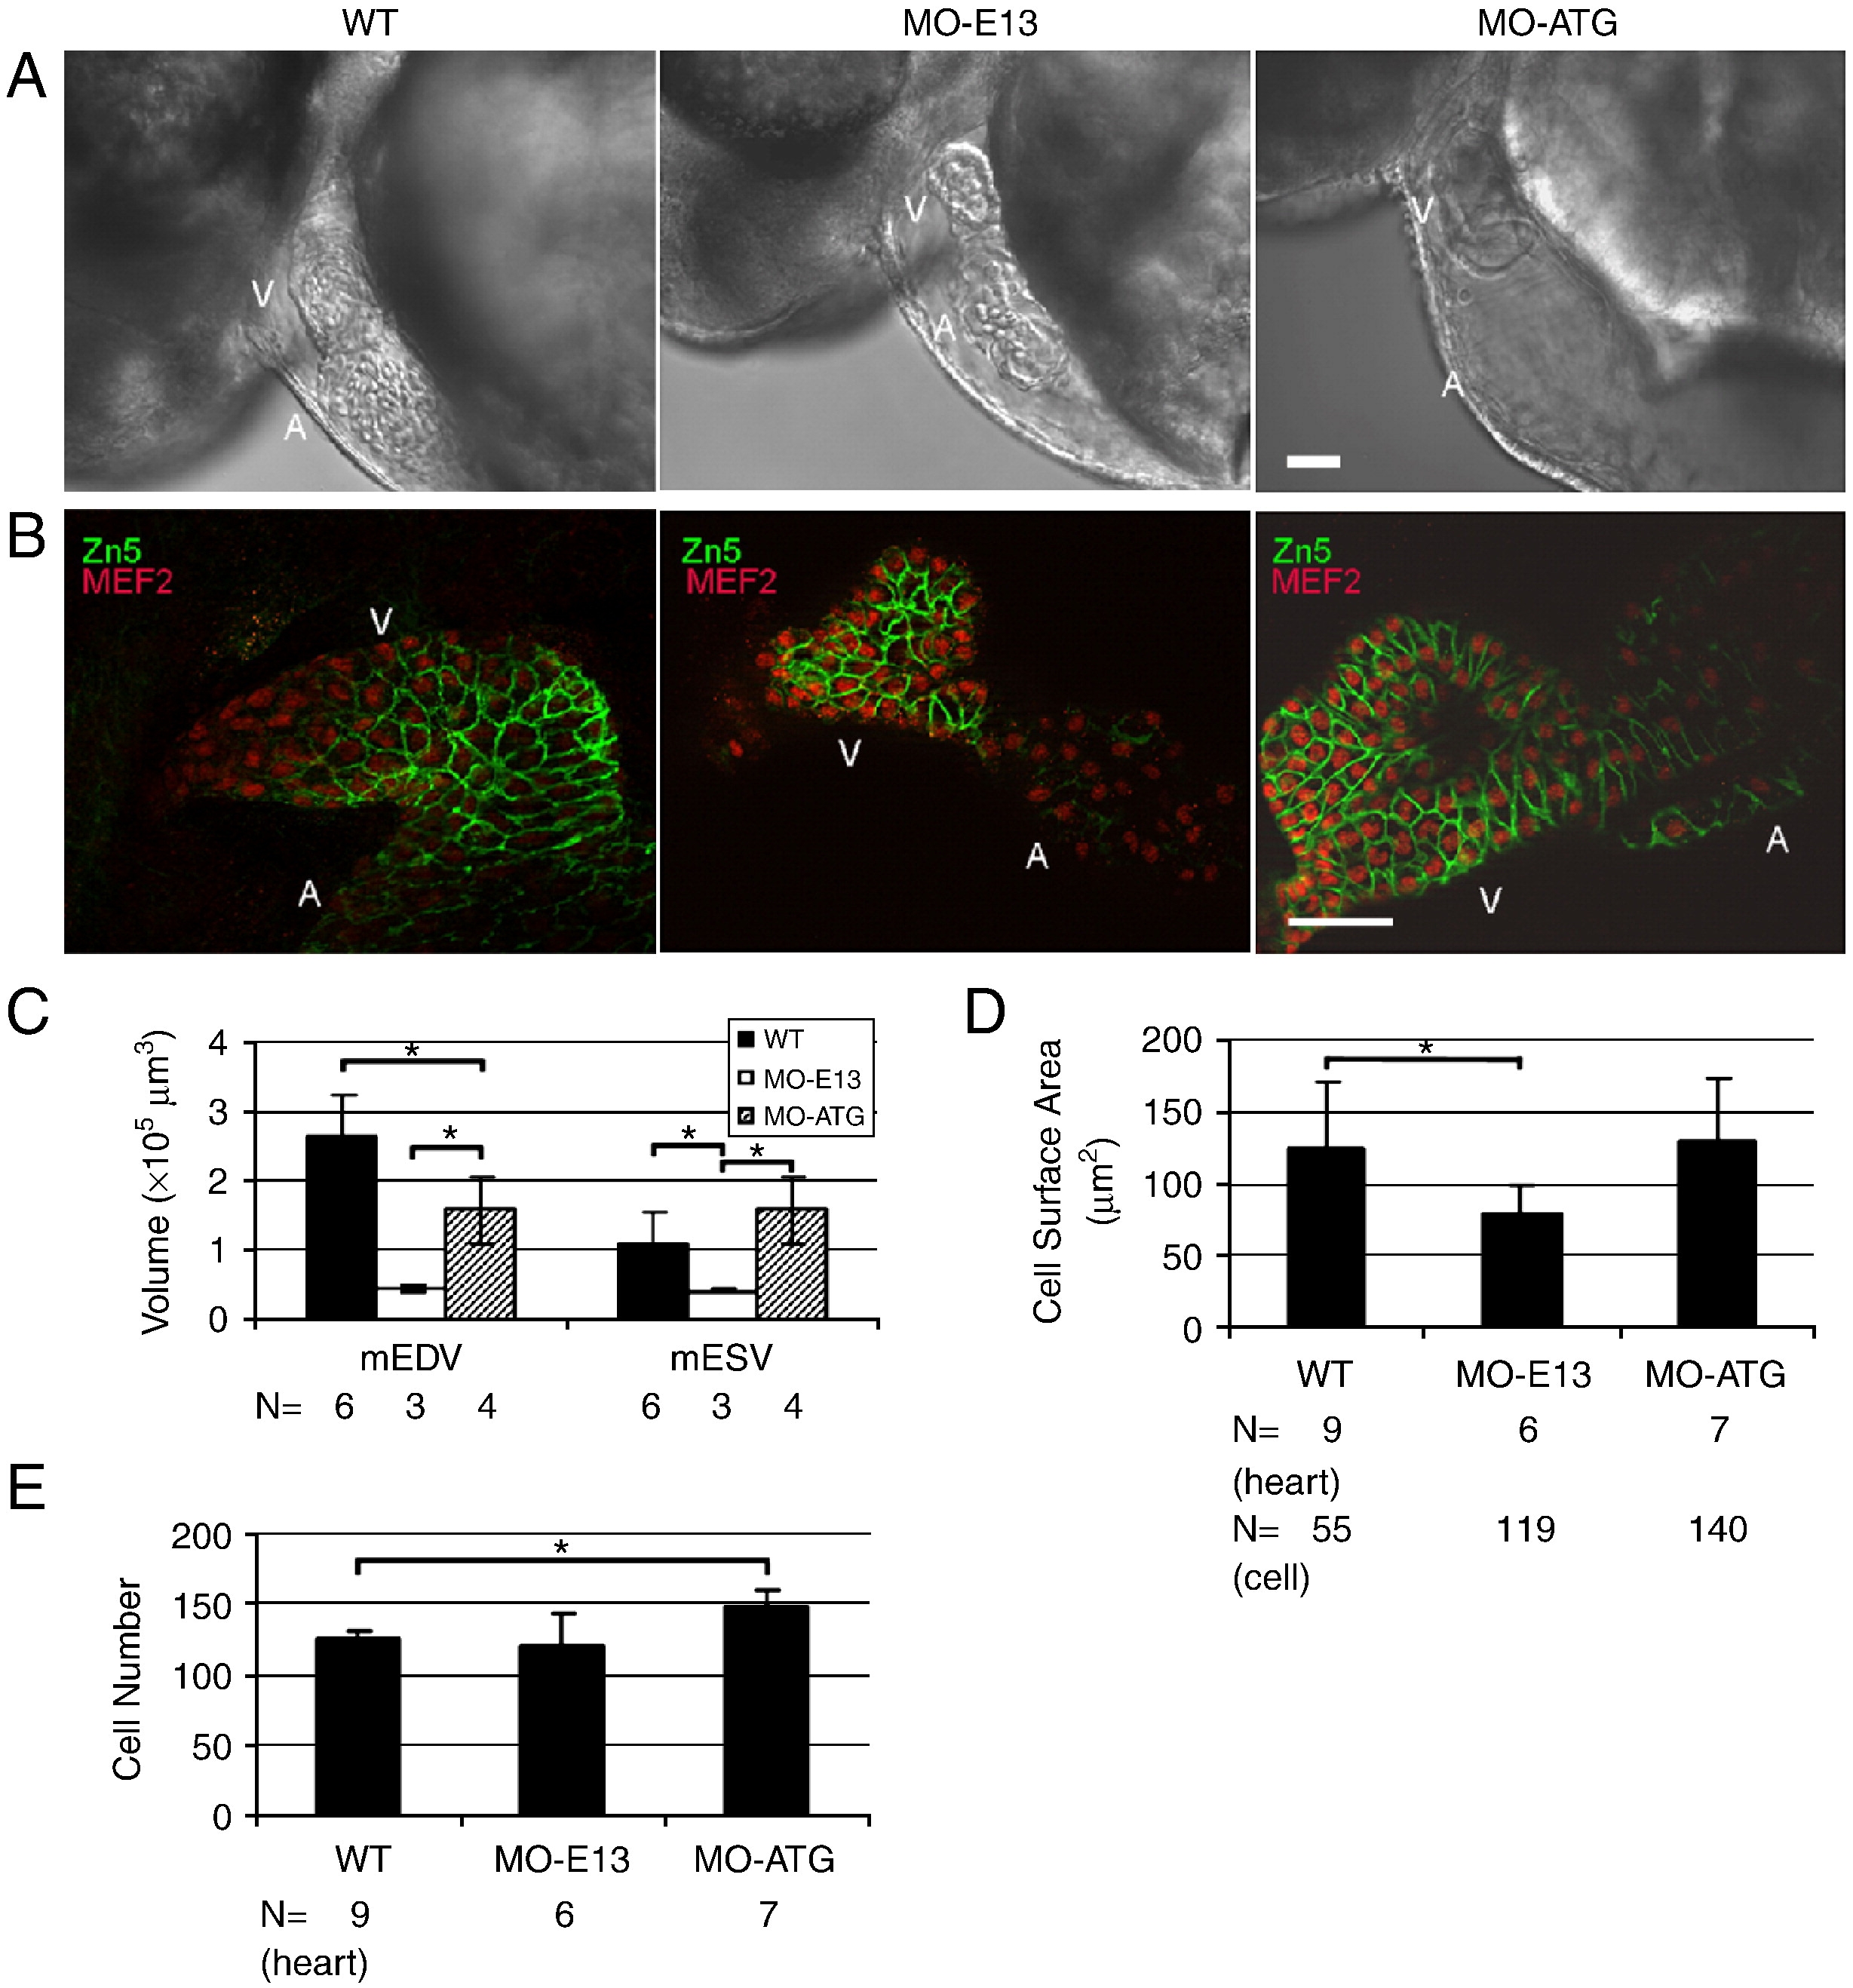
Fig. 7 Injection of MO-ATG and MO-E13 results in different changes in the size and number of ventricular cardiomyocytes. (A) Shown are lateral images of hearts in live WT and morphant embryos, 48 hpf. Ventricle in MO-E13 morphants appears smaller than WT. V, ventricle. A, atrium. (B) Shown are images of 48 hpf embryos after two-color immunostaining using Zn5 to reveal cell borders of cardiomyocytes (green) and mef2c to reveal nuclei of cardiomyocytes (red). V, ventricle. A, atrium. (C) Quantification of end-systolic and diastolic ventricular volume (mESV and mEDV, respectively) at 48 hpf. Shown are mean ± s.d. N, number of hearts quantified. (D) Quantification of the surface area of individual cardiomyocytes from a ventricular chamber at 48 hpf. Shown are mean ± s.d. N, number of hearts and cells quantified. (E) Quantification of ventricular cardiomyocyte number at 48 hpf. N, number of hearts quantified. *p < 0.01. Scale bar = 40 μm.
Reprinted from Developmental Biology, 331(2), Huang, W., Zhang, R., and Xu, X., Myofibrillogenesis in the Developing Zebrafish Heart: A Functional Study of tnnt2, 237-249, Copyright (2009) with permission from Elsevier. Full text @ Dev. Biol.