
Fig. 3
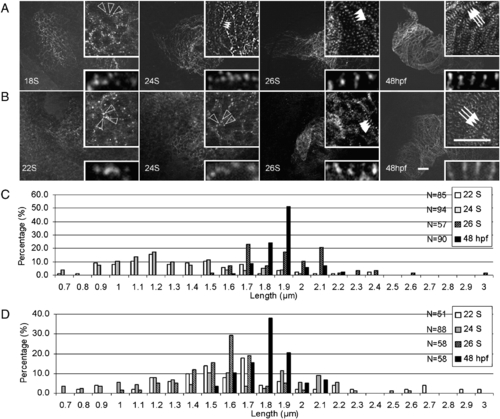
Assembly of α-actinin and myomesin in the embryonic zebrafish heart. Embryos at different stages were stained for α-actinin (A) and myomesin (B) to indicate assembly of the Z-disc and M-line. Before 22 S, α-actinin appears as irregular dot in the cell periphery region. The α-actinin dots become periodic at 24 S and the distance between them expands at 26 S. In contrast, myomesin dots are irregular before 24 S, and become periodic at 26 S. At 48 hpf, both α-actinin and myomesin dots undergo lateral growth to form the mature Z-disc and M-line. Open arrowheads, random dots of α-actinin (A) or myomesin (B). Indented arrowheads, α-actinin dots having shorter periodicity. Arrowheads, α-actinin dots (A) or myomesin (B) having longer periodicity. Arrows, mature Z-discs (A) or M-lines (B) after lateral growth. Insets are same images at higher magnification. Scale bar = 20 μm. Distribution of the distance between two neighboring α-actinin or myomesin dots at different developmental stages is illustrated in C and D, respectively. The x-axis represents the length of sarcomere unit, while the y-axis shows the percentage of sarcomere units with a particular length. N, total number of sarcomere units quantified at each stage. |
Reprinted from Developmental Biology, 331(2), Huang, W., Zhang, R., and Xu, X., Myofibrillogenesis in the Developing Zebrafish Heart: A Functional Study of tnnt2, 237-249, Copyright (2009) with permission from Elsevier. Full text @ Dev. Biol.