
Image
|
Figure Caption
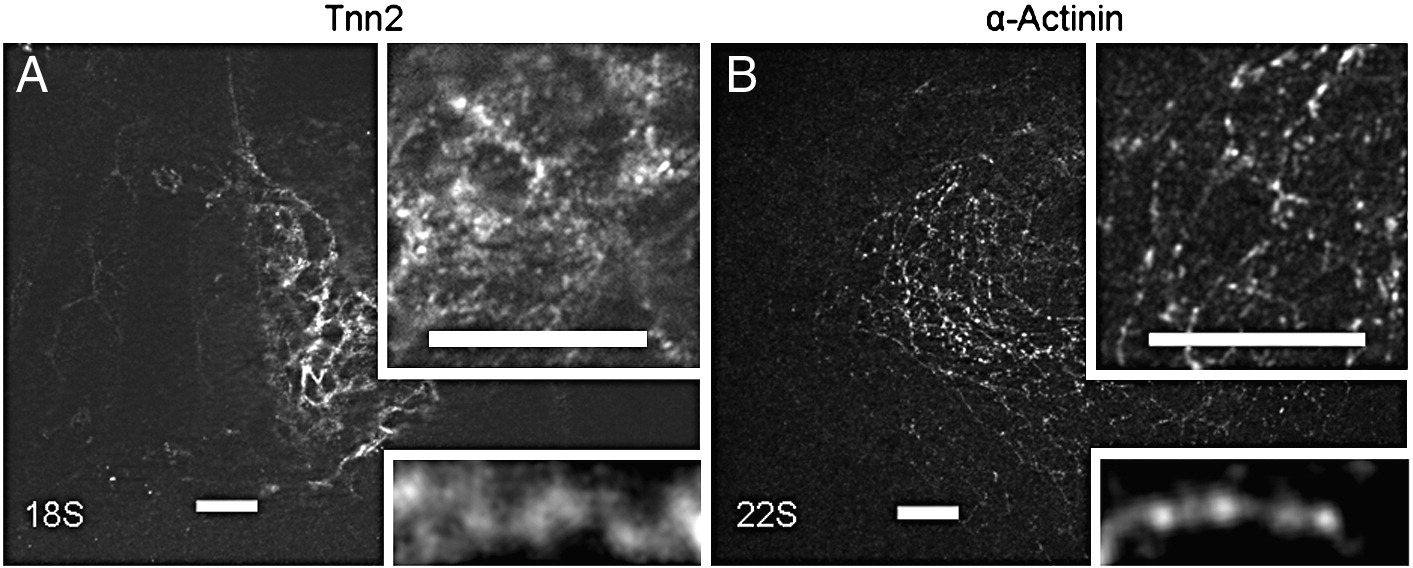
Fig. S2 Immunostaining for tnnt2 (A) and α-actinin (B) in the WT heart at early stages. At 18 S, tnnt2 appears as dotted pattern that associates with the thin filament network in perimembrane region. At 22 S, α-actinin dots start to be periodic, but show a shorter distance between two neighboring α-actinin dots than at 26 S. Insets are of the same image of higher magnification to reveal networks (at top), and a myofibril (at bottom). Scale bar = 20 μm.
Acknowledgments
This image is the copyrighted work of the attributed author or publisher, and
ZFIN has permission only to display this image to its users.
Additional permissions should be obtained from the applicable author or publisher of the image.
Reprinted from Developmental Biology, 331(2), Huang, W., Zhang, R., and Xu, X., Myofibrillogenesis in the Developing Zebrafish Heart: A Functional Study of tnnt2, 237-249, Copyright (2009) with permission from Elsevier. Full text @ Dev. Biol.