
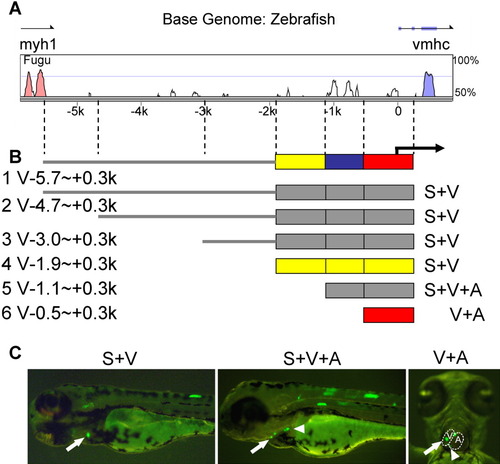
Identification of a 2.2-kb fragment from a ventricle-specific promoter. A: Sequence comparison of upstream intergenic sequences between the zebrafish vmhc gene with its Fugu homologue. Red and blue peaks represent coding regions for myh1 and vmhc, respectively. White peaks represent inter-species conserved regions. B: Summary of promoter analysis by transient co-injection of naked DNA with an EGFP fragment. The full-length intergenic V-5.7∼+0.3k fragment can drive GFP expression in both the somites and ventricle, as can the V-4.7∼+0.3k, V-3∼+0.3k, and V-1.9∼+0.3k fragments. However, V-1.1∼+0.3k drives GFP expression in both the ventricle and atrium, and V-0.5∼+0.3k drives GFP expression in the heart but not in the somites. The yellow, blue, and red bars on the top line represent fragments required for chamber specificity, somite expression, and cardiac expression, respectively. The yellow or red bars below represent the minimal element sufficient for chamber-specific or cardiac expression, respectively. C: Representative pictures of 3-dpf embryos after co-injection of promoter DNA and the EGFP fragment. Left and middle panels are lateral views; anterior to the left. The right panel is a ventral view; anterior to the top. GFP-positive cells can be detected in single cells or in a group of cells in the somites (left and middle panel) or the heart. The ventricle (indicated by arrows) and the atrium (indicated by arrowheads) could be distinguished due to embryo transparency. |
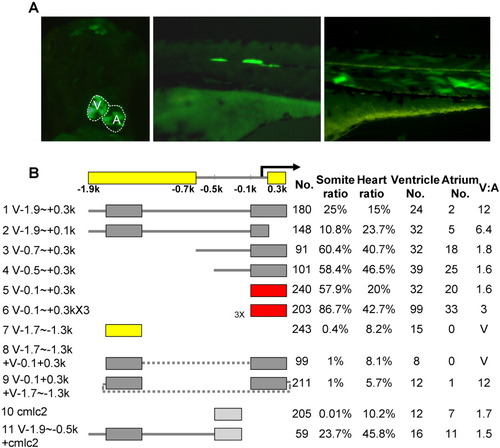
Dissection of the vmhc promoter by transient assays using Tol2-based vectors. A: Representative pictures of 3-dpf embryos injected with Tol2 transposon constructs containing vmhc promoter sequences (left and right panel, V-0.5∼+0.3k; middle panel, V-1.9∼+0.3k). Shown in the left panel is a ventral view with anterior to the top; right and middle panels are lateral views with anterior to the left. Multiple GFP-positive cells could be detected in the heart (left) and/or skeletal muscle, including the eye muscle, muscle pioneer cells located in the body midline (middle), and myocytes in the somites (right). B: Schematic summary of results from transient assays using the Tol2 transposon system. A distal (V-1.9∼-0.7k) and a proximal (V+0.1∼+0.3k) element required for the chamber specificity were identified, consistent with results from transient co-injection assays in Figure 2. A shorter distal element (V-1.7∼-1.3k, line 7) is sufficient to drive ventricle-specific expression in this assay. In contrast to results from transient co-injection assays, the proximal element (V-0.1∼+0.3k, line 5) drives GFP expression in the whole heart without chamber specificity in Tol2-based assays. When the distal and proximal elements are linked in tandem (line 8) or in reverse (line 9), the constructs drive GFP expression in the ventricle. However, the distal element cannot alter the expression of the cardiac cmlc2 promoter to be chamber-specific (line 11), which by itself drives GFP expression in the whole heart (line 10). The minimal elements required for chamber specificity (yellow bars, top line), for chamber-restricted expression (yellow bars, line 7) and for cardiac expression (red bars, lines 5-6) are indicated. No., number of injected embryos that survived to 4 dpf; Somite ratio/Heart ratio, number of fish with tissue-restricted GFP-positive cells over total number of fish that survived to 4 dpf; Ventricle No. or Atrium No., number of fish with GFP-positive cells in the ventricle or atrium. A fish with GFP-positive cells in both chambers was counted in both categories. V:A, ratio of GFP-positive cells in the ventricle over that in the atrium. |
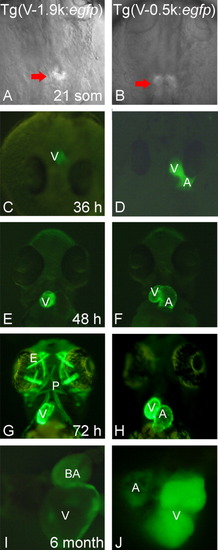
Results from stable transgenic lines are consistent with those from transient assays. A, C, E, G, I: Transgenic fish expressing GFP under the control of the V-1.9∼+0.3k fragment. B, D, F, H, J: Transgenic fish expressing GFP under the control of the V-0.5∼+0.3k fragment. GFP expression begins around the 21-somite stage (A, B). The Tg(V-1.9k:egfp) transgenic line expresses GFP only in the ventricle as well as in both embryonic (C, E, G) and adult stages (I), while the Tg(V-0.5k:egfp) line expresses GFP in the whole heart (D, F, H, J). Tg(V-1.9k:egfp) has an early onset and drives strong GFP expression in the extraocular muscles, pharyngeal muscles, and other muscle types (G; Supp. Fig. S3C, F), while Tg(V-0.5k:egfp) has a late onset and drives weak GFP expression in these muscles types (H; Supp. Fig. S3H). V, ventricle; A, atrium; E, extraocular muscles; P, pharyngeal muscles; BA, bulbus arteriosus. A,B: Dorsal view, anterior to the top. C,D: Head on view. E-H: Ventral view, anterior to the top. I,J: Dissected adult heart. |
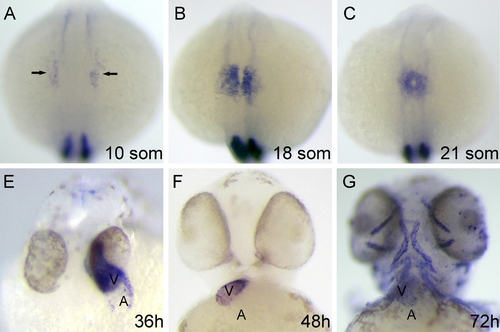
vmhc gene expression profile. In situ hybridization results of embryos at various stages. The MyoD riboprobe was included in A-C to ensure proper staging. The vmhc transcript could be detected in the anterior lateral plate mesoderm as early as the 10-somite stage (A). Expression persists in the heart progenitor region, which migrates toward the midline (B), fuses to form a heart tube (C), and differentiates into two distinct chambers (D-F). vmhc expression can be detected in the extraocular muscles and pharyngeal muscles after 3 dpf (F). |
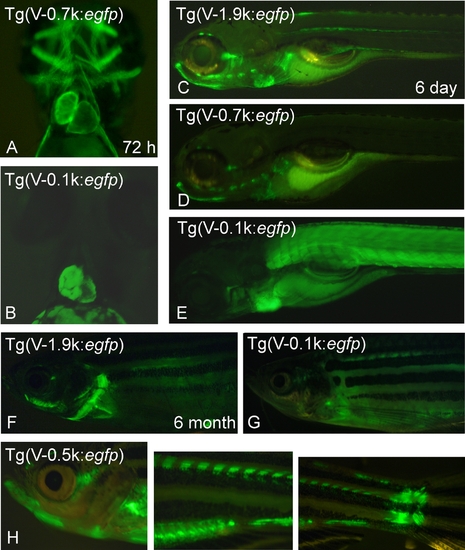
Transgenic fish also express GFP in different muscles. A,B: Tg(V-0.7k:egfp) embryos at 72 hpf exhibited an early onset and strong GFP expression in the extraocular and pharyngeal muscles (A), while Tg(V-0.1k:egfp) embryos did not (B). C-E: Day-6 larval fish from different transgenic lines express GFP in multiple muscles. Similar to Tg(V-0.7k:egfp) fish expressing GFP in the extraocular muscles, pharyngeal muscles, and fin musculature (D), Tg(V-1.9k:egfp) fish also express GFP in myocytes in the body midline (C). In contrast, Tg(V-0.1k:egfp) fish display very weak GFP expression in the cephalic musculature, but strong expression in trunk muscles (E). F-H: Adult 6-month-old fish from different transgenic lines also exhibit varied GFP expression patterns. Most lines have strong (F, H) or weak (G) GFP expression around the eye, jaw, and on the operculum. Muscles near the pectoral and tail fins frequently show GFP signals, as do the dorsal, ventral, and anal fins (H). |