
|
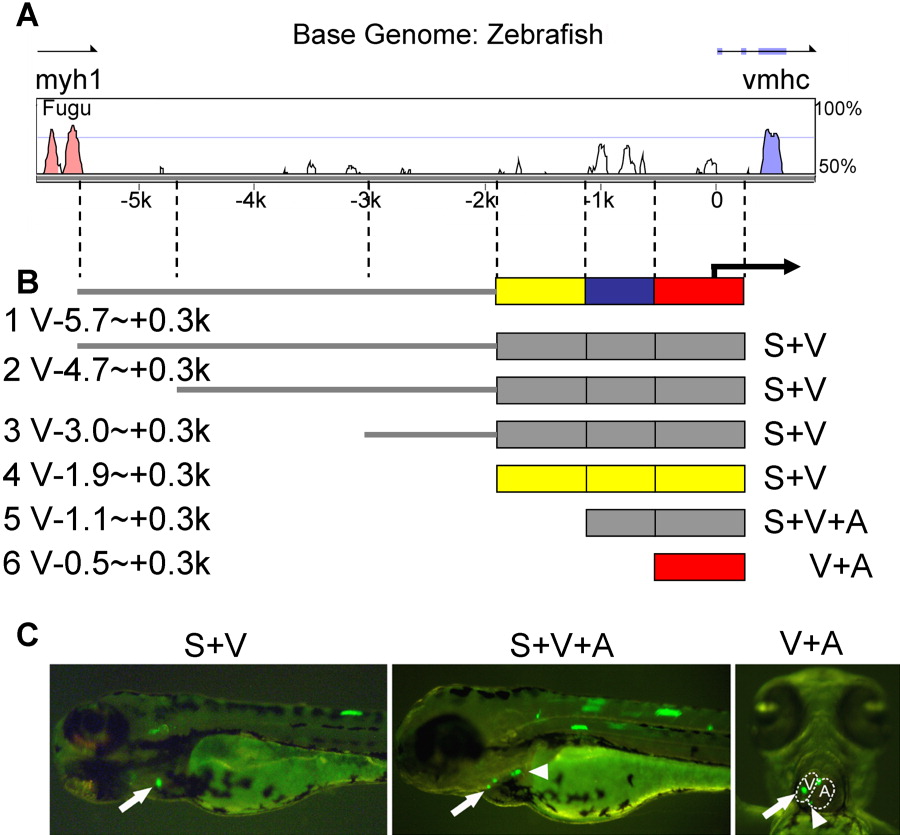
Fig. 1 Identification of a 2.2-kb fragment from a ventricle-specific promoter. A: Sequence comparison of upstream intergenic sequences between the zebrafish vmhc gene with its Fugu homologue. Red and blue peaks represent coding regions for myh1 and vmhc, respectively. White peaks represent inter-species conserved regions. B: Summary of promoter analysis by transient co-injection of naked DNA with an EGFP fragment. The full-length intergenic V-5.7∼+0.3k fragment can drive GFP expression in both the somites and ventricle, as can the V-4.7∼+0.3k, V-3∼+0.3k, and V-1.9∼+0.3k fragments. However, V-1.1∼+0.3k drives GFP expression in both the ventricle and atrium, and V-0.5∼+0.3k drives GFP expression in the heart but not in the somites. The yellow, blue, and red bars on the top line represent fragments required for chamber specificity, somite expression, and cardiac expression, respectively. The yellow or red bars below represent the minimal element sufficient for chamber-specific or cardiac expression, respectively. C: Representative pictures of 3-dpf embryos after co-injection of promoter DNA and the EGFP fragment. Left and middle panels are lateral views; anterior to the left. The right panel is a ventral view; anterior to the top. GFP-positive cells can be detected in single cells or in a group of cells in the somites (left and middle panel) or the heart. The ventricle (indicated by arrows) and the atrium (indicated by arrowheads) could be distinguished due to embryo transparency.