
- Title
-
Retinoic acid and Cyp26b1 are critical regulators of osteogenesis in the axial skeleton
- Authors
- Spoorendonk, K.M., Peterson-Maduro, J., Renn, J., Trowe, T., Kranenbarg, S., Winkler, C., and Schulte-Merker, S.
- Source
- Full text @ Development
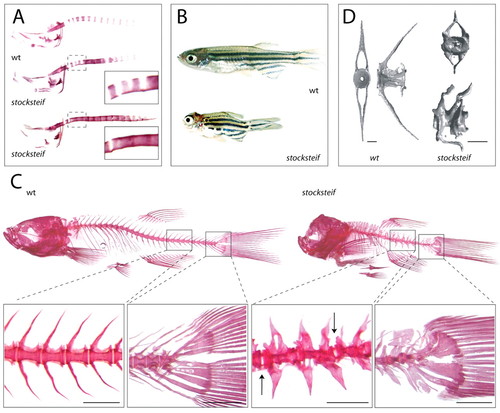
stocksteif mutants exhibit over-ossification of the larval and adult vertebral column. (A) Alizarin Red bone staining of a wild-type embryo and two stocksteif embryos at 8 dpf. Insets show that the initial spacing of vertebrae is normal (upper inset), but that excessive bone formation causes fusion of the future vertebrae (both insets). (B) Sibling wild-type and stocksteif juveniles (2 months). Pictures are taken at the same magnification. (C) Alizarin Red bone staining of wild-type and stocksteif juveniles (2 months) shown to scale with magnifications of part of the vertebral column and the tail. In mutants, vertebrae are usually fused with each other, and only few intervertebral boundaries can be observed (arrows). Hypural elements in the tail are also fused. Note expansion of both neural and haemal arches in mutants. Scale bars: 500 μm. (D) MicroCT scans of wild-type (3 months) and stocksteif juveniles (2 months) show that mutants exhibit completely solid centra, with the central opening (area of the nucleus pulposus) completely filled by excess bone. Scale bars: 100 μm. PHENOTYPE:
|
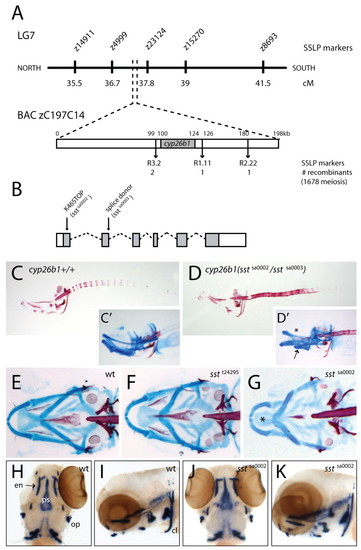
stocksteif encodes cyp26b1. (A) stocksteif was mapped to a narrow region on linkage group 7. Flanking SSLP markers are both located on BAC zC197C14. cyp26b1 appears to be the only gene present on the clone. (B) Schematic overview of cyp26b1 structure on the genomic level with nonsense (K46STOP or sstsa0002) and splice donor (sstsa0003) mutation indicated. Translated parts of the exons are shaded. (C,D) Alizarin Red bone staining of a cyp26b1+/+ embryo and a transheterozygous cyp26b1(sstsa0002/sstsa0003) embryo. (C′,D′,E-G) Double staining with Alcian Blue for cartilage and Alizarin Red for bone. (C′,D′) A cyp26b1+/+ embryo shows normal cartilage, whereas a transheterozygous cyp26b1(sstsa0002/sstsa0003) embryo shows missing tissue dorsal to the ethmoid plate (asterisk) and fusion of the ceratohyal with the basihyal (arrow). (E-G) Ventral views of a wild-type embryo (E), a homozygous sstt24295 mutant (F) and a homozygous sstsa0002 mutant (G). Note the reduced and misshaped ethmoid plate (asterisk) in the sstsa0002 mutant. (H-K) Expression of col10a1 is not changed in 4 dpf wild-type siblings (H,I) versus mutants (J,K). cl, cleithrum; en, entopterygoid; op, operculum; ps, parasphenoid. |
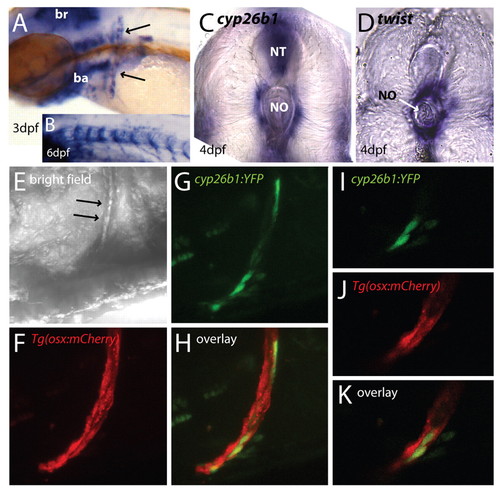
cyp26b1 is expressed in zebrafish osteoblasts. (A-C) cyp26b1 expression in zebrafish. (A) Early cyp26b1 expression in zebrafish is found in the hindbrain, branchial arches, pectoral fins and the cleithrum (arrows). (B) At 6 dpf, cyp26b1 expression is seen in a segmented pattern around the notochord. A mutant embryo is shown, as cyp26b1 mRNA levels are higher in mutants than wild-type embryos. (C,D) Vibratome transverse sections (4 dpf, 100 μm) showing cyp26b1 expression (C) surrounding the notochord (no) and in the neural tube (nt), and expression of the sclerotome marker twist in cells juxtaposed to the notochord (D), similar to cyp26b1 expression. (E) Bright-field view of an embryonic trunk with arrows indicating the cleithrum. (F-K) Co-localization of cyp26b1:YFP and osx:mCherry in osteoblasts of the cleithrum. (F) Cleithrum cells are labelled in Tg(osx:mCherry) embryos. (G,H) Transient expression of cyp26b1:YFP in cells of the cleithrum at 4 dpf, with projection in H demonstrating colocalization of both genes in the same cells. (I-K) Single confocal scans of a part of the projections shown in F-H. Anterior is towards the left, except where stated otherwise. EXPRESSION / LABELING:
|
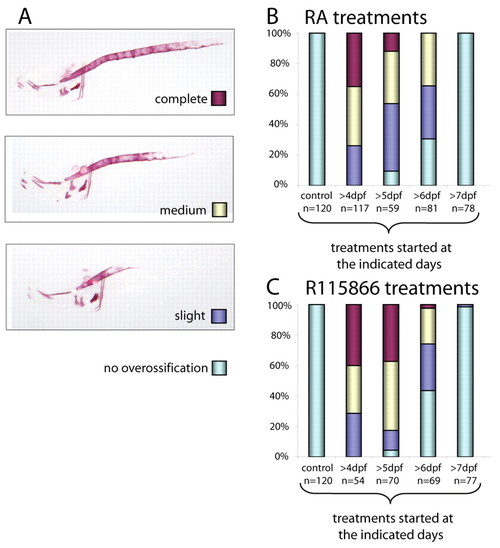
Treatment of wild-type embryos with either retinoic acid or R115866 phenocopy the stocksteif mutant phenotype. (A) After treatment of wild-type embryos with 1 μM RA, three phenotypic classes were observed, with the most severe phenotype completely mimicking the sst mutant phenotype. (B) Results are shown for RA treatments that were started at the days indicated and continued until the embryos were fixed at 8 dpf. Control treatments with only DMSO were started at day 4. (C) Treatment of wild-type embryos with 0.5 μM R115866 resulted in the same three phenotypic classes as shown for the RA treatments in A. |
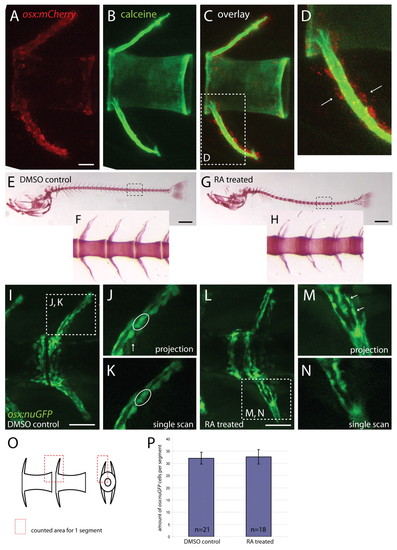
RA treatment does not increase the number of osterix:nuGFP-positive osteoblasts in the centrum. (A-D) osx:mCherry expressing osteoblasts in a vertebra of a 20-day-old zebrafish. (A) osx-expressing cells are positioned around arches and at the anterior and posterior edges of each centrum, which is counterstained with calcein in B. Part of the overlay in C is shown in D. Osteoblasts are positioned distal to the produced bone matrix (examples are indicated with arrows). (E-H) Alizarin Red bone staining of 20-day-old zebrafish embryos treated with DMSO (E, enlargement in F) or 0.1 μM RA (G, enlargement in H) showing over-ossification of the vertebral column in RA-treated specimen. (I-N) osx:nuGFP expressing osteoblasts in 20-day-old zebrafish embryos treated with DMSO (I, enlargement in J) or 0.1 μM RA (L, enlargement in M). Single scans of one focal plane (K) were used to count cells. Cells indicated with arrows in projections (J,M) are not seen in single scans (K,N) as they belong to the arch at the opposite site. In single scans, cells can be distinguished from each other whereas in projections this is not always clear (encircled spot in J was resolved to represent two different cells in K). (M,N) High magnifications of a haemal arch that were actually not used for counting. (O) Schematic representation of vertebrae shows defined area in which cells were counted per segment. (P) Cell counts show no difference between DMSO controls and treated embryos in amount of osx:nuGFP positive osteoblasts. Scale bars: 25 μm in A-C; 500 μm in E,G; 50 μm in I,L. EXPRESSION / LABELING:
|
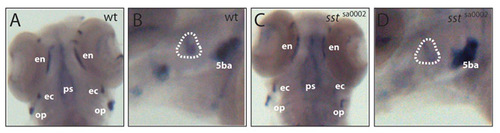
Osterix expression in siblings versus mutants. Expression of osx is not changed in 4 dpf siblings (A,B) versus mutants (C,D). Operculum is encircled in B,D. 5ba, 5th branchial arch; ec, ectopterygoid; en, entopterygoid; op, operculum; ps, parasphenoid. EXPRESSION / LABELING:
|
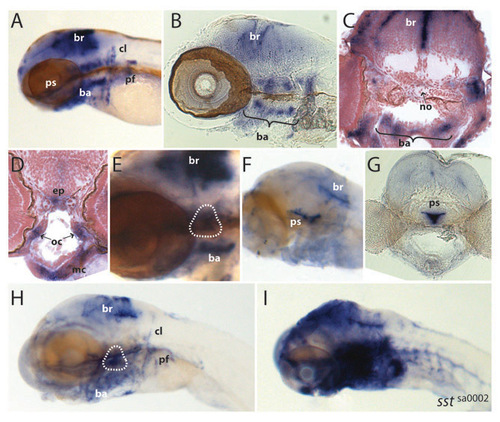
Cyp26b1 expression in zebrafish. (A-E) Cyp26b1 expression in zebrafish at 3 dpf. (F-I) Cyp26b1 expression in zebrafish at 6 dpf. For sectioned material, in situ hybridization was performed on whole-mount embryos, and subsequently sections were cut using a vibratome (100 μm; B,G) or a microtome (10 μm; C,D). Expression of cyp26b1 is seen in the hindbrain, branchial arches, pectoral fins and ossified structures such as the operculum (encircled in E and H) and the parasphenoid (F,G). ba, branchial arches; br, brain; cl, cleithrum; ep, ethmoid plate; mc, meckel’s cartilage; no, notochord; oc, orbital cartilage; pf, pectoral fin; ps, parasphenoid. (F,G) Embryos that were only shortly stained show extensive staining in the parasphenoid. (H,I) Sibling (H) and sstsa0002 mutant (I) embryos showing massive upregulation of cyp26b1 expression in mutants. Identically treated sibling embryos are depicted. Genotypes were determined by sequence analysis. Other than the embryo in I, all embryos are wild type. EXPRESSION / LABELING:
|