
Fig. 6
- ID
- ZDB-IMAGE-081104-19
- Genes
- Publication
- Spoorendonk et al., 2008 - Retinoic acid and Cyp26b1 are critical regulators of osteogenesis in the axial skeleton
- All Figures
- Figures for Spoorendonk et al., 2008
|
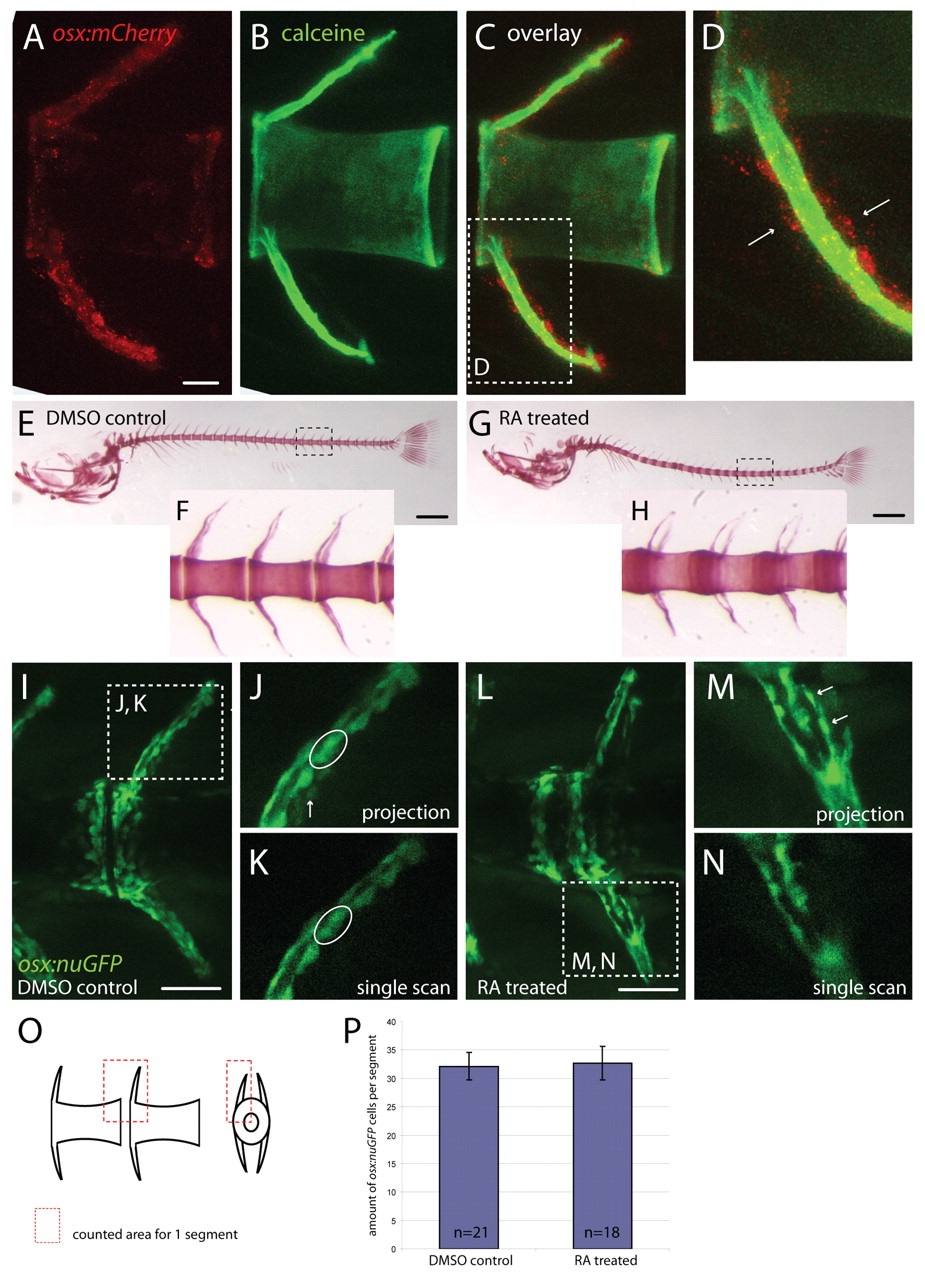
Fig. 6 RA treatment does not increase the number of osterix:nuGFP-positive osteoblasts in the centrum. (A-D) osx:mCherry expressing osteoblasts in a vertebra of a 20-day-old zebrafish. (A) osx-expressing cells are positioned around arches and at the anterior and posterior edges of each centrum, which is counterstained with calcein in B. Part of the overlay in C is shown in D. Osteoblasts are positioned distal to the produced bone matrix (examples are indicated with arrows). (E-H) Alizarin Red bone staining of 20-day-old zebrafish embryos treated with DMSO (E, enlargement in F) or 0.1 μM RA (G, enlargement in H) showing over-ossification of the vertebral column in RA-treated specimen. (I-N) osx:nuGFP expressing osteoblasts in 20-day-old zebrafish embryos treated with DMSO (I, enlargement in J) or 0.1 μM RA (L, enlargement in M). Single scans of one focal plane (K) were used to count cells. Cells indicated with arrows in projections (J,M) are not seen in single scans (K,N) as they belong to the arch at the opposite site. In single scans, cells can be distinguished from each other whereas in projections this is not always clear (encircled spot in J was resolved to represent two different cells in K). (M,N) High magnifications of a haemal arch that were actually not used for counting. (O) Schematic representation of vertebrae shows defined area in which cells were counted per segment. (P) Cell counts show no difference between DMSO controls and treated embryos in amount of osx:nuGFP positive osteoblasts. Scale bars: 25 μm in A-C; 500 μm in E,G; 50 μm in I,L.