
- Title
-
A zebrafish bmyb mutation causes genome instability and increased cancer susceptibility
- Authors
- Shepard, J.L., Amatruda, J.F., Stern, H.M., Subramanian, A., Finkelstein, D., Ziai, J., Finley, K.R., Pfaff, K.L., Hersey, C., Zhou, Y., Barut, B., Freedman, M., Lee, C., Spitsbergen, J., Neuberg, D., Weber, G., Golub, T.R., Glickman, J.N., Kutok, J.L., Aster, J.C., and Zon, L.I.
- Source
- Full text @ Proc. Natl. Acad. Sci. USA
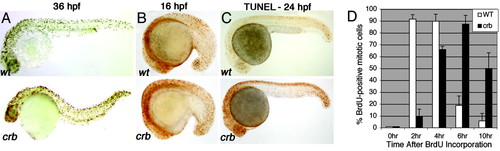
A forward genetic screen in zebrafish identified a proliferation mutant, crash&burn.(A) Depiction of the cell-proliferation phenotype (by pH3 staining) of one of the eight mutants isolated in the screen, crash&burn (crb). Embryos are 36-hpf diploids. (B) pH3 staining of crb mutant diploid embryos at 16 hpf. (C) crb has increased numbers of apoptotic cells at 24 hpf as shown by TUNEL staining. (D) Time course of crb and wild type progression from S phase into G2/Mas shown by BrdUrd incorporation followed by pH3 analysis at varying time points after incorporation. PHENOTYPE:
|
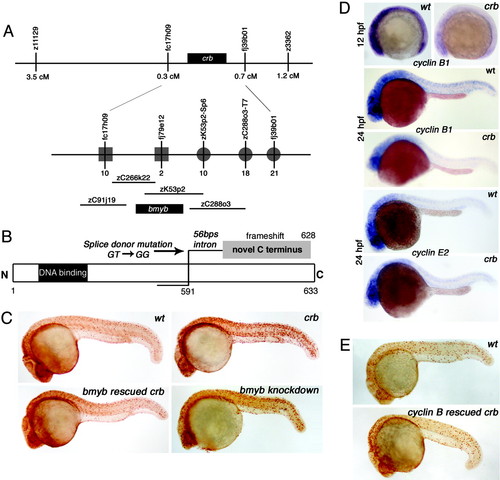
bmyb is the crb gene and may act through regulation of cyclin B. (A) crb positional cloning schematic with an enlarged view of the crb locus that depicts the BAC genomic clones identified in a chromosomal walk in analysis of 3,068 meioses from diploid mutants. The number of recombination events identified from the distal side (squares) and proximal side (circles) are indicated. (B) Schematic representation of the mutation in bmyb found in the crb mutants. Splice donor mutation (GT to GG) occurred between exon 13 and exon 14 (just after amino acid 591) causing a frameshift in the protein. (C) Phenotypic rescue (assessed by pH3 staining) of 24-hpf crb embryos by injection of bmyb mRNA and phenocopy of crb by injection of bmyb morpholinos. (D) Whole-mount embryo mRNA in situ hybridization analysis for cyclin B1 and cyclin E2. (E) Phenotypic rescue of 24 hpf crb embryos by injection of cyclin B1 mRNA. EXPRESSION / LABELING:
PHENOTYPE:
|
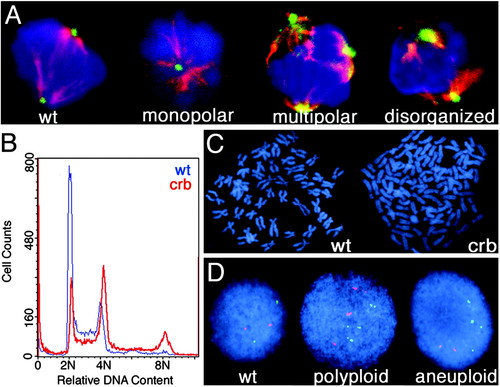
crb embryos exhibit abnormal mitoses and genomic instability. (A) Mitotic cells shown stained with DAPI (blue), α-tubulin (red), and γ-tubulin (green). (B) DNA content of crb (red) and wild-type (blue) embryos as measured by flow cytometry. (C) Metaphase chromosome spreads from a diploid cell containing 50 chromosomes (Left) and a crb hypertetraploid cell containing 108 chromosomes (Right). (D) FISH analysis on crb mutant embryos with probes for linkage group 2 (red) and linkage group 16 (green) and DAPI counterstaining. PHENOTYPE:
|
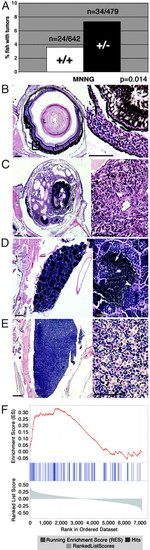
crb adult heterozygotes have an increased susceptibility to cancer. (A) Percentage of wild-type or crb heterozygous fish that developed tumors after MNNG treatment. (B–E) The most common tumors seen in crb heterozygotes after MNNG treatment (C and E) and the corresponding wild-type structures (B and D). (Scale bars: Left, 200 μm; Right,50 μm.) (B) Sagittal section through normal zebrafish eye. Lens (L), retina (R), and normal choroidal vascular plexus (VP) are shown. (C) Vascular neoplasm arising in the retinal vascular plexus and pushing the retina to the center of the eye. The tumor is composed of plump, atypical endothelial cells forming vascular channels. (D) Sagittal section through normal zebrafish testis containing spermatogonia located at the tubule periphery (white arrowhead), spermatocytes with more condensed nuclei (white asterisk), and fully differentiated spermatozoa (white arrow). (E) Testicular germ cell tumor where the lobular architecture of the testis is completely effaced by a massive proliferation of undifferentiated spermatogonia. Spermatocytes and spermatozoa have been replaced by the tumor. (F) Enrichment plot of the B-myb signature genes in the human lung adenocarcinoma data set. The plot shows the location of the B-myb signature genes (blue bars) in the gene list ranked by the p53 phenotype. The running enrichment score as a function of position in the gene list is shown in red. The signal-to-noise scores of all 7,129 genes in the gene list are shown in gray, with positive scores representing markers for the p53 mutant class and negative scores representing markers for the p53 wild-type class. The signature genes are clearly overrepresented at the left side of the gene list, representing their enrichment in the p53 mutant class. PHENOTYPE:
|
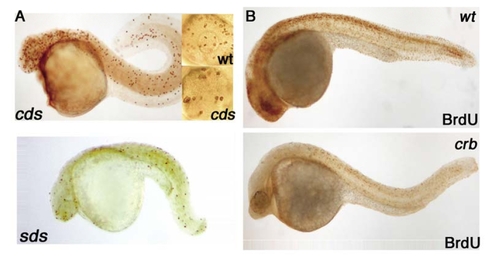
A cell proliferation screen identified zebrafish cell-cycle mutants. (A) Depiction of the cell proliferation phenotype (by pH3 staining) of two of the eight mutants isolated in the screen: standstill (sds), and cease&desist (cds). For cds, insets represent wild-type (top) and cds mutant (bottom) eyes. All embryos are 36-hpf diploids. (B) Relative levels of cells in S phase as judged by BrdUrd incorporation in crb and wild-type embryos at 28 hpf. |
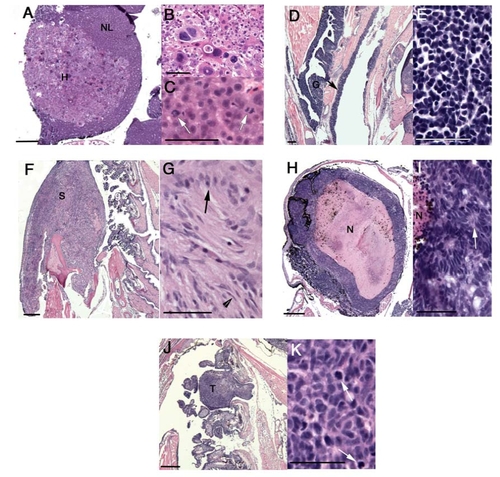
Additional tumors arising in crb adult heterozygotes treated with MNNG. (Scale bars: Left, 200 mm; Right, 50 mm.) (A–C) Hepatocellular carcinoma (H) arising within an otherwise normal liver (NL). The tumor has irregular boarders, pushing between normal hepatocytes (A). The tumor is composed of atypical hepatocytes with irregularly shaped, hyperchromatic, and occasionally extremely enlarged nuclei (B). Mitotic figures are abundant (C, arrow). (D and E) Lymphoma infiltrating the gills (G) and the esophageal mucosa (D, arrow). The lesion is composed of a monomorphic proliferation of small to medium sized lymphocytes with minimal cytoplasm (E). (F and G) Schwannoma (S) arising within the ventral body wall. The tumor grows into and compresses the gills (G) and forms an external nodule (F). The tumor is composed of spindled cells, some with narrow, tapered nuclei (G, arrowhead) and others with more plump nuclei forming palisades (G, arrow). (H and I) Sagittal section through the eye showing complete effacement of the retinal architecture by a retinoblastoma (compare H with Fig. 4B). The tumor is composed of a proliferation of medium-sized cells with irregular nuclei and minimal cytoplasm that surround a necrotic core (N). In areas, the cells are organized into Homer-Wright pseudorosettes (I, arrow). (J and K) Gill carcinoma. The tumor (T) arises within and completely effaces one of the gills (J). The tumor is composed of sheets of epithelial cells with enlarged, irregular, hyperchromatic nuclei and a high nuclear to cytoplasmic ratio (K). Mitotic figures are abundant (K, arrow). PHENOTYPE:
|

Unillustrated author statements |