
- Title
-
The recombination activation gene 1 (Rag1) is expressed in a subset of zebrafish olfactory neurons but is not essential for axon targeting or amino acid detection
- Authors
- Feng, B., Bulchand, S., Yaksi, E., Friedrich, R.W., and Jesuthasan, S.J.
- Source
- Full text @ BMC Neurosci.
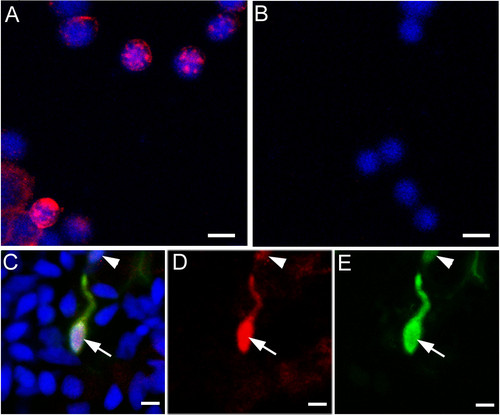
Immunofluorescent labelling of RAG1. (A) Isolated zebrafish thymocytes, labelled with the antibody to RAG1 (in red) and DAPI (blue). (B) After pre-absorption with the peptide used for immunization, no labelling was detected. (C-E) Double-label of olfactory epithelial cells isolated from a Rag1:GFP transgenic fish. RAG1 protein (C, D; red) is present in the GFP-positive (C, E; green) neurons (arrow and arrowhead). Neurons with high (arrow) or low (arrowhead) GFP levels contain RAG1. DAPI (C; blue) is used to stain nuclei. Bar = 5 µm. EXPRESSION / LABELING:
|
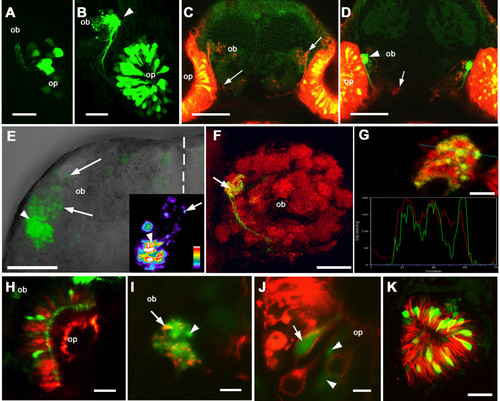
Expression of Rag1 in zebrafish olfactory system. (A) At 22 hours post-fertilization, a few olfactory sensory neurons express GFP under the Rag1 promoter. (B) At 3 dpf, fluorescing axons have reached the bulb. A single target (arrowhead) is innervated by brightly labelled axons. (C, D) Frontal view of an 8-day old larva, with DiI labeling of olfactory sensory neurons (red) and Bodipy labeling of inter-cellular spaces (dim green). (C) A shallow section of the labelled forebrain, with DiI-labelled olfactory axons visible (arrows). In a deeper section (D) the GFP-containing axons (arrowhead) can be seen, along with other DiI-labelled axons (arrow). (E) Dorsal view of an isolated forebrain from a 4 day-old fish, showing the left olfactory bulb. Anterior is to the top and the midline is indicated by the dotted line. Strong GFP fluorescence is seen in axon terminals in a single region of the lateral bulb (arrowhead), while axons with lower levels of GFP innervate other regions of the lateral bulb (arrows). The inset shows one optical section, colour-coded according to fluorescence intensity. Termini with high (arrowhead) and low (arrow) intensity are indicated. (F) Frontal view of glomerular structures in the olfactory bulb of a 4-day fish, labelled with an antibody to synaptic vesicles. Only one lateral structure is innervated by OSNs with strong GFP expression (arrow). Lateral is to the left, while dorsal is to the top. (G) A single optical section through the glomerular target containing GFP-expressing neurons. The marker for synaptic vesicles (red) and GFP appear to co-localize, as indicate by the linescan. (H) An olfactory pit labeled with DiI. The GFP-expressing cells (green) have not taken up DiI (red). (I, J) A Di8ANEPPQ-labeled olfactory system of a Rag1:GFP transgenic fish. In the olfactory bulb (I), some axons with strong GFP expression (green) are also labeled with Di8ANEPPQ (red; arrow), whereas others are not (arrowhead). (J) In this section through the olfactory epithelium, a GFP-expressing neuron was labeled with Di8ANEPPQ (arrow), whereas two others were not (arrowheads). (K) The olfactory pit of a fish transgenic for Rag1:GFP and omp:tauDsRed. GFP expressing cells (green) are distinct from those labeled with DsRed. Panels A, B, E, F and K are projections reconstructed from Z stacks. ob: olfactory bulb; op: olfactory pit. Bar = 20 µm (A, B, E, F, H, I, K); 50 µm (C, D,); 5 µm (G, J). EXPRESSION / LABELING:
|
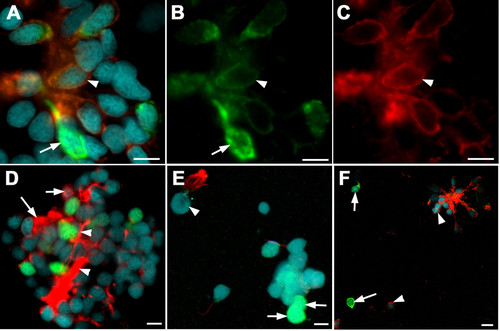
Expression of G alpha subunits in larval olfactory neurons.(A-C) Gαo (red fluorescence, C) is present in a subset of Rag1-expressing cells (green fluorescence, B; arrowheads) isolated from the olfactory epithelium of a Rag1:GFP zebrafish. A cell with bright GFP (arrow), however, does not contain Gαo. (D) Gαq label in the dendrites, lacks GFP. Two cells with bright GFP (arrows), in contrast, lack Gαq label. (F) Gαolf label, seen here in axons and some cell bodies (arrowheads), was not detected in cells strongly expressing GFP (arrows). Bar = 5 µm (A-E); 10 µm (F). |
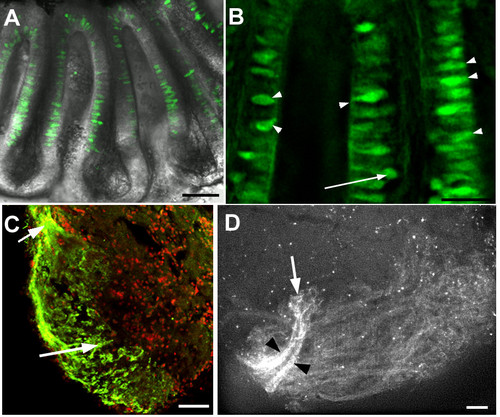
Expression of Rag1 in the adult zebrafish olfactory system.(A) An olfactory rosette isolated from a 1.5 year-old adult. GFP-expressing cells are located in the sensory region of the lamella and midline raphe. Most cell bodies are located apically. (B) High magnification of lamella from another olfactory rosette, also from a 1.5 year-old adult. GFP-expressing cells have differing morphologies. Many have the cell body close to the apical surface (arrowheads). The arrow indicates one neuron with a deep cell body. (C) Anti-GFP immunofluorescence on a horizontal section through the olfactory bulb of an adult. Label is detectable only in olfactory sensory neurons innervating the lateral bulb. The incoming olfactory nerve is visible at the upper left (arrow). Anterior is to the top-left; lateral to the bottom-left. Nuclei are labelled with propidium iodide (red). (D) Lateral view of an olfactory bulb dissected from a 1.5-year-old Rag1:GFP male. Axons innervate a large portion of the lateral bulb, but axons with the highest levels of GFP (black arrowheads) form two bundles that innervate a single region (arrow). Other glomeruli are innervated by dimmer axons. Bar = 50 µm (A, C, D); 20 µm (B). EXPRESSION / LABELING:
|
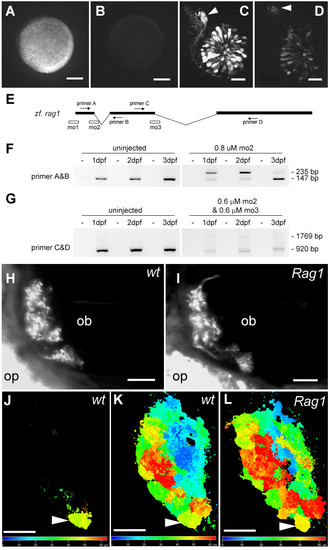
The effect of RAG1 depletion on the olfactory projection. (A) An embryo injected with mRNA encoding the 5' end of Rag1 fused to EGFP. (B) An embryo co-injected with the Rag1-EGFP fusion mRNA and mo1. (C) Olfactory neurons labelled with GFP under the Rag1 promoter, with brightly labeled axons projecting to a single target (arrowhead), at 3 dpf. (D) In a transgenic embryo injected with mo1, axons still project to the same target (arrowhead), but the intensity of GFP fluorescence is reduced. (E) A schematic diagram of the Rag1 gene, showing the location of morpholinos and primers that were used to analyse morpholino-injected fish. (F) RT-PCR on control or mo2 injected embryos. Abnormal splicing occurs in the morpholino-injected fish, leading to a premature stop codon, as indicated by sequencing of the upper band. (G) RT-PCR after injection of a mixture of Rag1 mo2 and mo3, showing loss of the normal transcript. (H, I) A subset of Di8ANEPPQ-labeled olfactory sensory neurons in 7-day old wild type and Rag1 mutant fish. Axons innervate all target structures detectable in this optical plane in the mutant. (J-L) SV2-labelled 4 day-old Rag1:GFP transgenic (J, K) and Rag1 mutant (L) forebrains, shown in dorsal view. The images are colour-coded according to depth. The glomerulus innervated by the strong GFP-positive neurons (J) is indicated by the arrowhead. Bar = 100 µm (A, B); 20 µm (C, D, H-K). The colour bars in J and K indicate depth. Embryos in panels H-L are shown in dorsal view, with anterior to the left. |
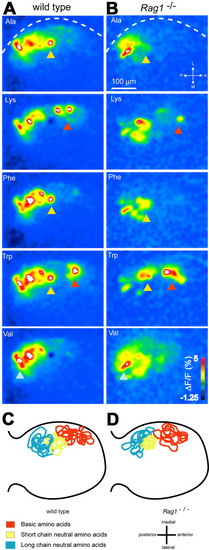
Chemotopic organization of glomerular activity patterns in wild type and Rag1 mutant fish. (A) Glomerular activity patterns evoked by different amino acid stimuli (10-5 M) in the ventro-lateral OB of a wild type fish. Changes in fluorescence intensity report activity of OSN axon terminals and are colour coded. Dashed line depicts lateral edge of the OB. Arrowheads indicate conserved clusters of glomeruli with defined response properties. (B) Glomerular activity patterns evoked by the same stimuli in a Rag1 mutant fish. The same general areas of the bulb show a response. The difference in the intensity seen here between wild type and mutants is not statistically significant. (C) Overlay of positions of identifiable glomerular regions in wild type of the line from which Rag1 mutants were derived (n = 7). Regions were outlined manually in activity maps in each fish. Outlines from different individuals were centered on the central cluster (yellow). (D) Overlay of cluster positions determined in 10 Rag1 mutant fish. |