- Title
-
Multiple roles for Hedgehog signaling in zebrafish pituitary development
- Authors
- Sbrogna, J.L., Barresi, M.J., and Karlstrom, R.O.
- Source
- Full text @ Dev. Biol.
|
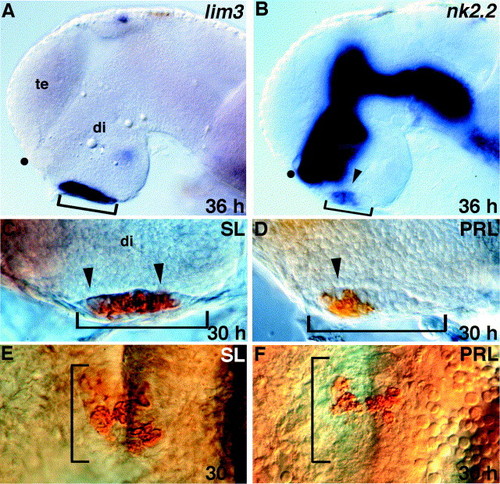
Regionalization of the early adenohypophysis. (A) lim3 is expressed in the entire adenohypophyseal placode. (B) nk2.2 is expressed in the anterior region (arrowhead) of the placode. (C, E) Somatolactin (SL)-secreting cells are present throughout the adenohypophysis at 30 h (arrowheads). (D, F) Prolactin (PRL)-secreting cells are present only in the anterior region of the adenohypophysis at 30 h (arrowhead). (A–D) Lateral views, eyes removed, anterior to the left. (E, F) Ventral views, anterior up. Brackets show anterior/posterior extent of the morphologically visible placode. te, telencephalon; di, diencephalon; dot shows position of optic recess. |
|
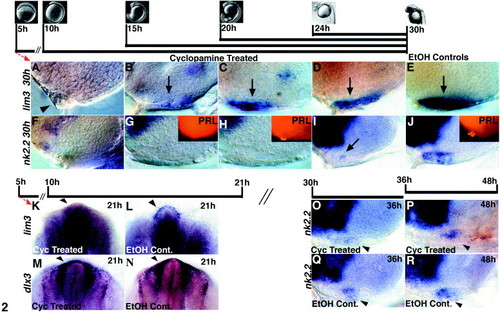
Timed inhibition of Hh signaling with cyclopamine. Initiation and duration of cyclopamine treatment is indicated by black bars with images showing appropriately staged embryos (images from Karlstrom and Kane, 1996). Embryos in (A–J) were fixed and labeled at 30 h. (A) Treatments starting at 5 or 10 h result in the loss of a visible adenohypophyseal placode and loss of all lim3 expression at 30 h. These embryos often develop an ectopic lens in place of an adenohypophysis (arrowhead in A). (B) Treatment at 15 h severely reduces lim3 expression in a thin but visible placode. (C, D) Embryos treated starting at 20 or 24 h have smaller adenohypophyses with reduced lim3 expression. (E) Control embryos treated with an equal volume of EtOH (cyclopamine carrier) have normal adenohypophyses that express lim3. (F, G) Cyclopamine treatments starting at 5, 10, or 15 h eliminate nk2.2 expression and PRL cells (inset in G) at 30 h. (H) Treatment at 20 h eliminates nk2.2 expression and severely reduces PRL cell numbers (inset). (I) Cyclopamine treatment starting at 24 h reduces nk2.2 expression in the anterior adenohypophysis (arrow). (J) Normal nk2.2 and PRL labeling in EtOH-treated control embryos. (K) Cyclopamine treatments at 5 or 10 h eliminate lim3 expression at 21 h. (M) dlx3 expression at 21 h is not affected by early cyclopamine treatments. (L, N) lim3 and dlx3 expression in EtOH-treated controls. (O, Q) Cyclopamine treatment starting at 30 h reduces nk2.2 expression at 36 h relative to controls (arrowheads). (P, R) Embryos treated from 36–48 hours have nk2.2 expression similar to that seen in control treated embryos (compare arrowheads). (A–J) and (O–R) show lateral views, anterior to the left, eyes removed; (K–N) show dorsal/anterior views, anterior up. Cyo, cyclopamine. |
|
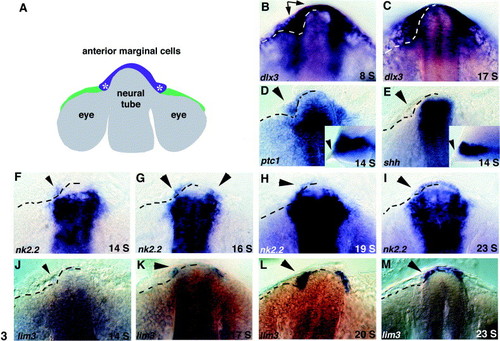
ptc1 and nk2.2 expression precedes lim3 expression in preplacodal cells at the anterior margin of the neural tube. (A) Schematic of the zebrafish forebrain during somitogenesis, dorsal view, anterior up. Based on expression of lim3 and fate mapping experiments, the pituitary placode arises from medially located cells (purple) at the anterior edge of the neural tube Glasgow et al 1997 and Whitlock and Westerfield 2000. Asterisks show where the pituitary transcription factors lim3 and nk2.2 are first expressed. (B) At the 8-somite (S) stage, the early placodal marker dlx3 labels marginal cells spanning the midline of the neural tube and more lateral cells that coalesce to form the olfactory placodes (arrows). (C) At 17 S, dlx3 is expressed by a thinner band of preplacodal cells at the anterior margin. (D) The Hh receptor ptc1 is expressed in neural tissue and in anterior marginal cells (arrowheads) at 14 S. Inset shows lateral view. (E) shh expression is restricted to neural tissue, no expression is seen in epidermal cells (arrowheads). Inset shows lateral view. (F) nk2.2 expression begins anterior to the neural tube as early as 14 S and is often seen only on the left side (arrowhead). (G) By 16 S, nk2.2 is expressed anterior to the neural tube on both sides of the embryo (arrowheads). (H, I) Between 19 and 23 S, nk2.2 expression expands across the midline in anterior marginal cells (arrowheads). (J) At 14 S, no lim3 expression is detectable in anterior marginal cells (arrowhead). (K) lim3 expression is first detectable at approximately 17 S (arrowhead). (L, M) Between 20 and 23 S, lim3 expression expands across the midline (arrowheads). All panels show dorsal/anterior views of the anterior edge of the nervous system, anterior up. Insets in (D) and (E) show lateral views, anterior to the left. Dotted lines on left side of embryo show position of the visible border between neural tissue and epidermal cells at the anterior margin of the nervous system. This border was established by careful examination of magnified images and multiple labeled embryos. |
|
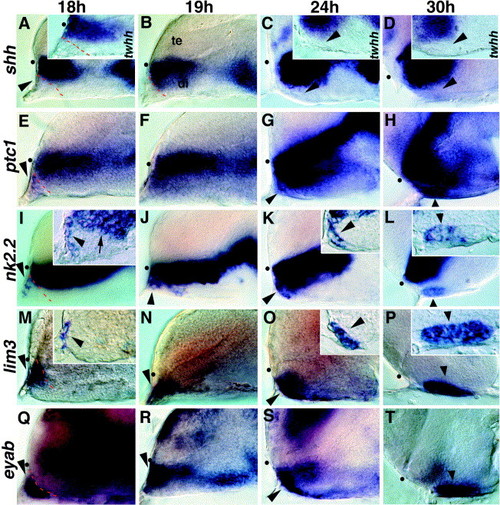
Regionalization within the developing adenohypophysis. (A–D) Expression of shh and twhh (insets) is restricted to the neural tube; no expression is seen in anterior epidermal cells (arrowhead in A). (E–H) ptc1 expression extends into nonneural cells at the anterior edge of the embryo, anterior to the shh expression domain (arrowheads). (I, J) nk2.2 is expressed anterior to the neural tube at 18 h (arrowhead), and this expression is distinct from the neural expression domain (arrow in inset). (K, L) At 24 and 30 h, nk2.2 is expressed in the anterior region of the visibly thickened adenohypophyseal placode (arrowheads) with expression restricted to the anterior region at both ages (arrowheads in insets). (M, N) lim3 expression anterior to the neural tube at 18 and 19 h (arrowhead). (O, P) lim3 continues to be expressed in the entire thickened placodal region at 24 and 30 h (arrowheads). (Q–T) The placodal marker eyaB is expressed throughout the adenohypophyseal placode (arrowheads). All panels show lateral views, eyes removed, anterior to the left. Insets show parasagittal sections. te, telencephalon; di, diencephalon; dot shows position of optic recess. |
|
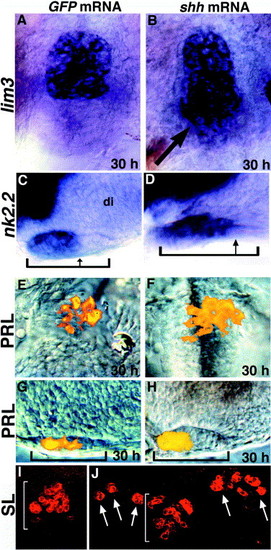
Ectopic shh expands lim3 and nk2.2 expression and induces PRL and SL cell populations. (A, B) lim3 expression in GFP mRNA-injected (A) and shh mRNA-injected (B) embryos. shh mRNA injections lead to posterior expansion of the lim3 expression domain (arrow in B). (C, D) nk2.2 expression in GFP mRNA-injected (C) and shh mRNA-injected (D) embryos. nk2.2 expression is expanded within the developing placode (compare arrows in C and D). (E–H) PRL cell populations in GFP (E, G) and shh (F, H) mRNA-injected embryos. The number of PRL-producing cells is consistently expanded in the anterior region of the adenohypophysis. (I) SL-producing cells are present throughout the adenohypophysis (bracket) in control (GFP) RNA-injected embryos. (J) Ectopic SL cells (arrows) are induced after shh mRNA injection. All panels show 30-h embryos that were injected with 100 pg of the indicated mRNA at the two- to four-cell stage. (A, B, E, F, I, J) Ventral views, anterior up. (C, D, G, H) Lateral views, eyes removed, anterior to the left. Brackets show anterior/posterior extent of adenohypophysis. di, diencephalon. |
|
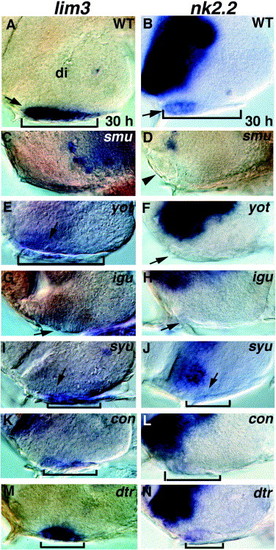
Pituitary defects in Hh pathway mutants. (A, B) Wild-type pituitary expression of (A) lim3 and (B) nk2.2 (arrows). (C, D) smu/smo mutant embryos lack a discernible adenohypophysis and often develop an ectopic lens (arrowhead in D). lim3 (C) and nk2.2 (D) expression is absent in the region. (E, F) yot/gli2-DR mutants have severely reduced or absent lim3 expression and no placodal nk2.2 expression (arrow). (G, H) igu mutants also have reduced or absent lim3 expression and no placodal nk2.2 expression (arrows). (I, J) syu/shh mutants have reduced lim3 expression and no placodal nk2.2 expression (arrows). (K, L) con and (M, N) dtr/gli1 mutants both have moderately reduced lim3 expression and reduced nk2.2 expression. Lateral views of ventral head, eyes removed, anterior to the left. Brackets show anterior/posterior extent of the adenohypophysis when visible. di, diencephalon. |
|
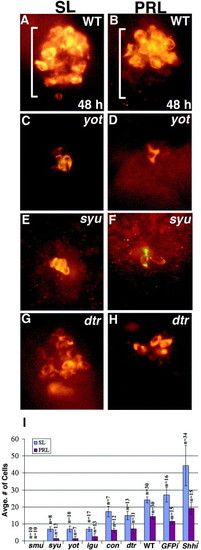
Reduction of Prolactin (PRL)- and Somatolactin (SL)-secreting cells in Hh pathway mutants. (A, B) In wild-type embryos, SL-secreting cells are present throughout the adenohypophysis, while PRL-secreting cells are only present anteriorly. (C, D) yot/gli2-DR and (E, F) syu/shh mutants have severely reduced numbers of SL- and PRL-secreting cells. (G, H) SL and PRL cells are more moderately reduced in dtr/gli1 mutant embryos. (I) Bar graph showing average numbers of SL and PRL cells in all of the mutants examined ± s.d., numbers of embryos indicated by n. Rightmost bars show numbers of cells present at 30 h following injection of 100 pg of shh mRNA at the two- to four-cell stage. (A–H) Ventral views of 48-h embryos. Brackets show anterior/posterior extent of the adenohypophysis in wildtype embryos. |
|
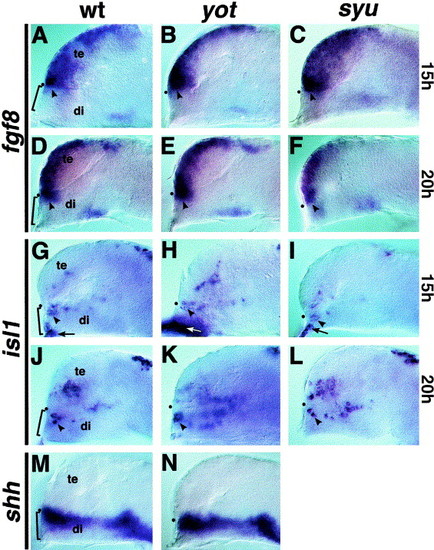
Forebrain marker expression in yot/gli2 and syu/shh mutant embryos. (A) The signaling molecule fgf8 is expressed in the telencephalon and in dorsal diencephalic cells adjacent to the developing adenohypophysis (bracket) at 15 h of development. (B, C) In yot/gli2 and syu/shh mutants, fgf8 is expressed normally in cells adjacent to the developing adenohypophysis (arrowheads), suggesting that fgf8 signaling defects do not account for the lack of pituitary development seen in these mutants. (D–F) At 20 h, fgf8 is still expressed adjacent and dorsal to the adenohypophysis in yot/gli2 and syu/shh mutants (arrowheads). (G) The transcription factor isl1 is expressed in adjacent diencephalic cells (arrowheads), as well as in epidermal cells (arrows) that are continuous with and overlap the developing adenohypophysis (bracket) at 15 h of development. (H, I) isl1 is expressed in these same adjacent cells in yot/gli2 and syu/shh mutants (compare arrowheads and arrows). Increased labeling in (H) is due to the presence of additional extraembryonic membrane. (J–L) isl1 is expressed in the diencephalon of both yot/gli2 and syu/shh mutants at 20 h (arrowheads), indicating this diencephalic cell type can differentiate in the absence of Shh signals. Epidermal isl1 expression is largely absent by 20 h in both wildtype and mutant embryos. (M, N) shh is appropriately expressed adjacent to the developing adenohypophysis at 15 h in yot/gli2 mutant embryos (arrowheads), showing that this region of the brain is capable of signaling to adjacent epidermal tissue. In all panels, a black dot shows the position of the optic recess, the anterior border between the telencephalon (te) and diencephalon (di). |
Reprinted from Developmental Biology, 254(1), Sbrogna, J.L., Barresi, M.J., and Karlstrom, R.O., Multiple roles for Hedgehog signaling in zebrafish pituitary development, 19-35, Copyright (2003) with permission from Elsevier. Full text @ Dev. Biol.

