Fig. 6
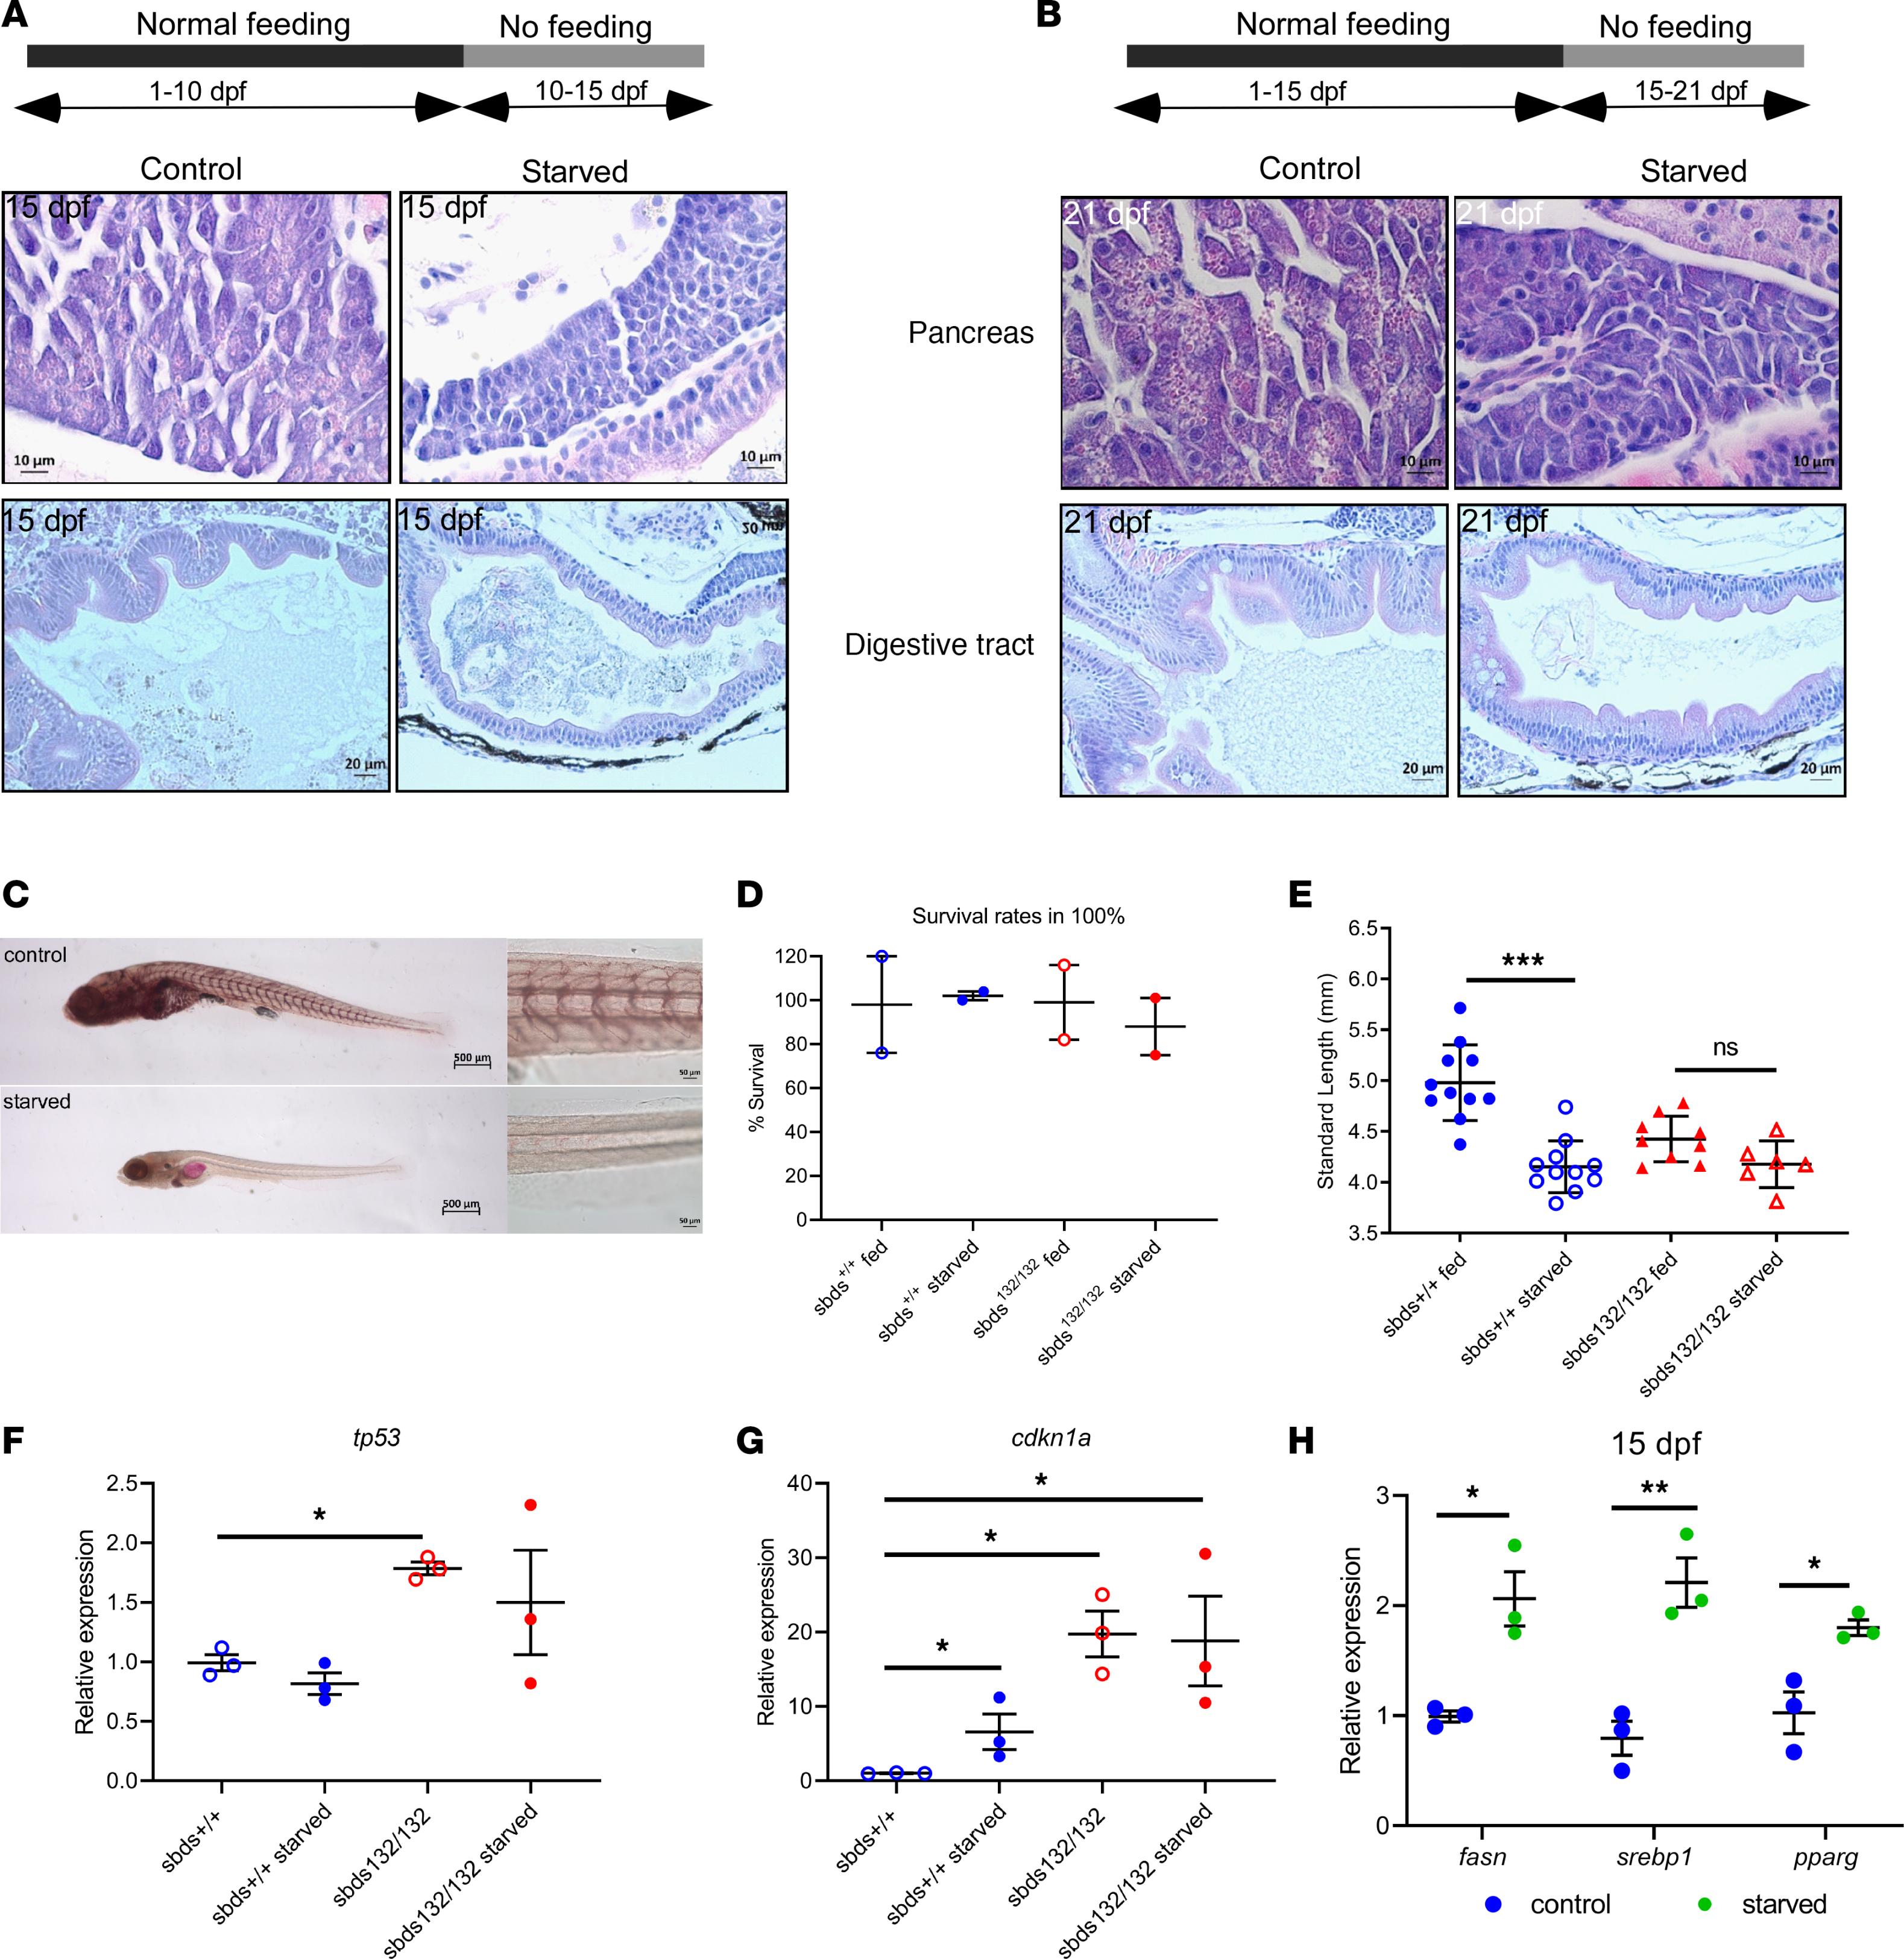
Fig. 6 (A and B) H&E staining of pancreas and digestive tract in starvation assays. (C) ORO staining for lipid accumulation in starved and fed fish for 10–15 or 15–21 dpf. A model of starvation was performed to determine size distribution and fin regeneration. Scale bars: 500 μm (left), 50 μm (right). (D) Survival rates and (E) size distribution in WT and mutants after starvation. Expression of (F) tp53 and (G) cdk1a show a dysregulation of cdkn1a in starved mutants. (H) Gene expression of lipid metabolism markers in starved WT fish. Statistical analysis was performed using the ANOVA and t test. *P < 0.05, **P < 0.001, ***P < 0.0001.

