IMAGE

Figure 2

ID
ZDB-IMAGE-200129-29
Genes
Source
Figures for Yang et al., 2019
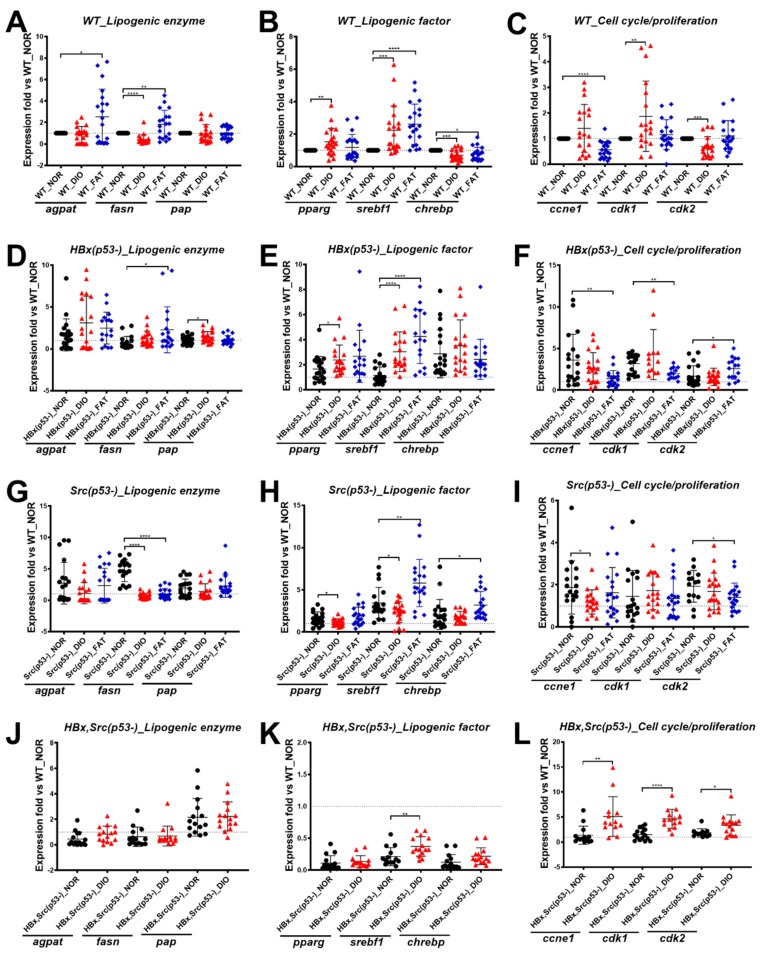
Image
Figure Caption

Figure 2

Expression of selected markers in various genetic background zebrafish fed with different diets. Expression of lipogenic enzymes (agpat, fasn, and pap), lipogenic factors (pparg, srebf1, and chrebp), and cell cycle/proliferation-related genes (ccne1, cdk1, and cdk2) in (AC) WT, (DF) HBx(p53-), (GI) Src(p53-), and (JL) HBx,Src(p53-) fish after eight weeks of normal diet (NOR), overfeeding (diet-induced obesity, DIO), or high-fat diet (FAT). The number of fish is 20 for each group, and the number of experimental replicates for qPCR analysis is three. Expression fold change compared to WT_NOR control. Statistical analysis of results was performed using a two-tailed Student’s t-test. Asterisks (*) represent level of significance: * p-value ≤ 0.05; ** p-value ≤ 0.01; *** p-value ≤ 0.001; **** p-value ≤ 0.0001.

Figure Data
Acknowledgments
This image is the copyrighted work of the attributed author or publisher, and ZFIN has permission only to display this image to its users. Additional permissions should be obtained from the applicable author or publisher of the image. Full text @ Cancers