
Fig. 2
- ID
- ZDB-IMAGE-171206-61
- Genes
- Antibodies
- Publication
- Witzel et al., 2017 - Isl2b regulates anterior second heart field development in zebrafish
- All Figures
- Figures for Witzel et al., 2017
|
Fig. 2
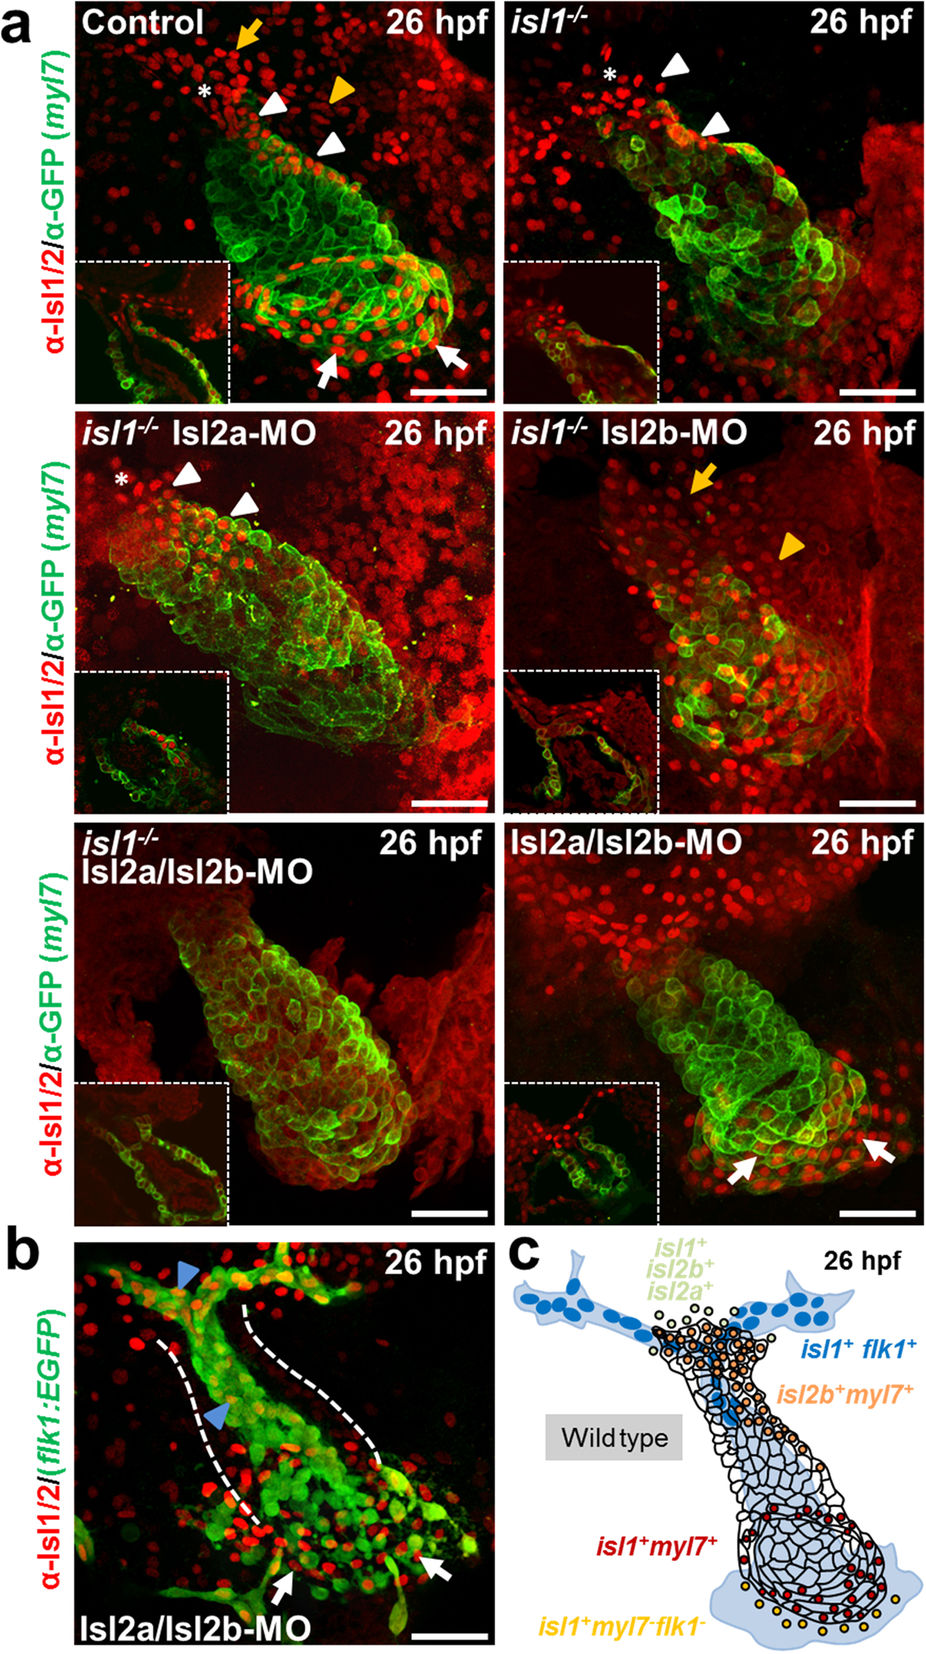
Islet family members are expressed in distinct patterns in the developing heart.
(a) Confocal images of control and Tg(myl7:EGFP-HsHRAS)s883isl1−/− embryos or Tg(myl7:EGFP-HsHRAS)s883 isl1−/− embryos following morpholino-mediated knockdown of Isl2a, Isl2b or Isl2a/Isl2b stained with anti-GFP and anti-Isl1/2 antibodies at 26 hpf. (b) Confocal images of Tg(flk1:EGFP) Isl2a/Isl2b morpholino-injected embryo stained with anti-GFP and anti-Isl1/2 antibodies at 26 hpf. Asterisk indicates the late ventricular region22. White arrows indicate Isl1+ cardiomyocytes at the venous pole of the atrium; yellow arrows point to Isl2a+ cells in the pericardial wall; yellow arrowheads point to Isl2a+ cells in the adjacent endoderm; white arrowheads point to Isl2b+ cardiomyocytes at the inner curvature of the ventricle and the outflow pole; blue arrowheads point to Isl1+ endothelial cells. Scale bars in (a,b), 50 μm. (c) Schematic representation of the distinct Isl1+, Isl2a+ and Isl2b+ populations at the linear heart tube stage.