
Fig. 2
|
Fig. 2
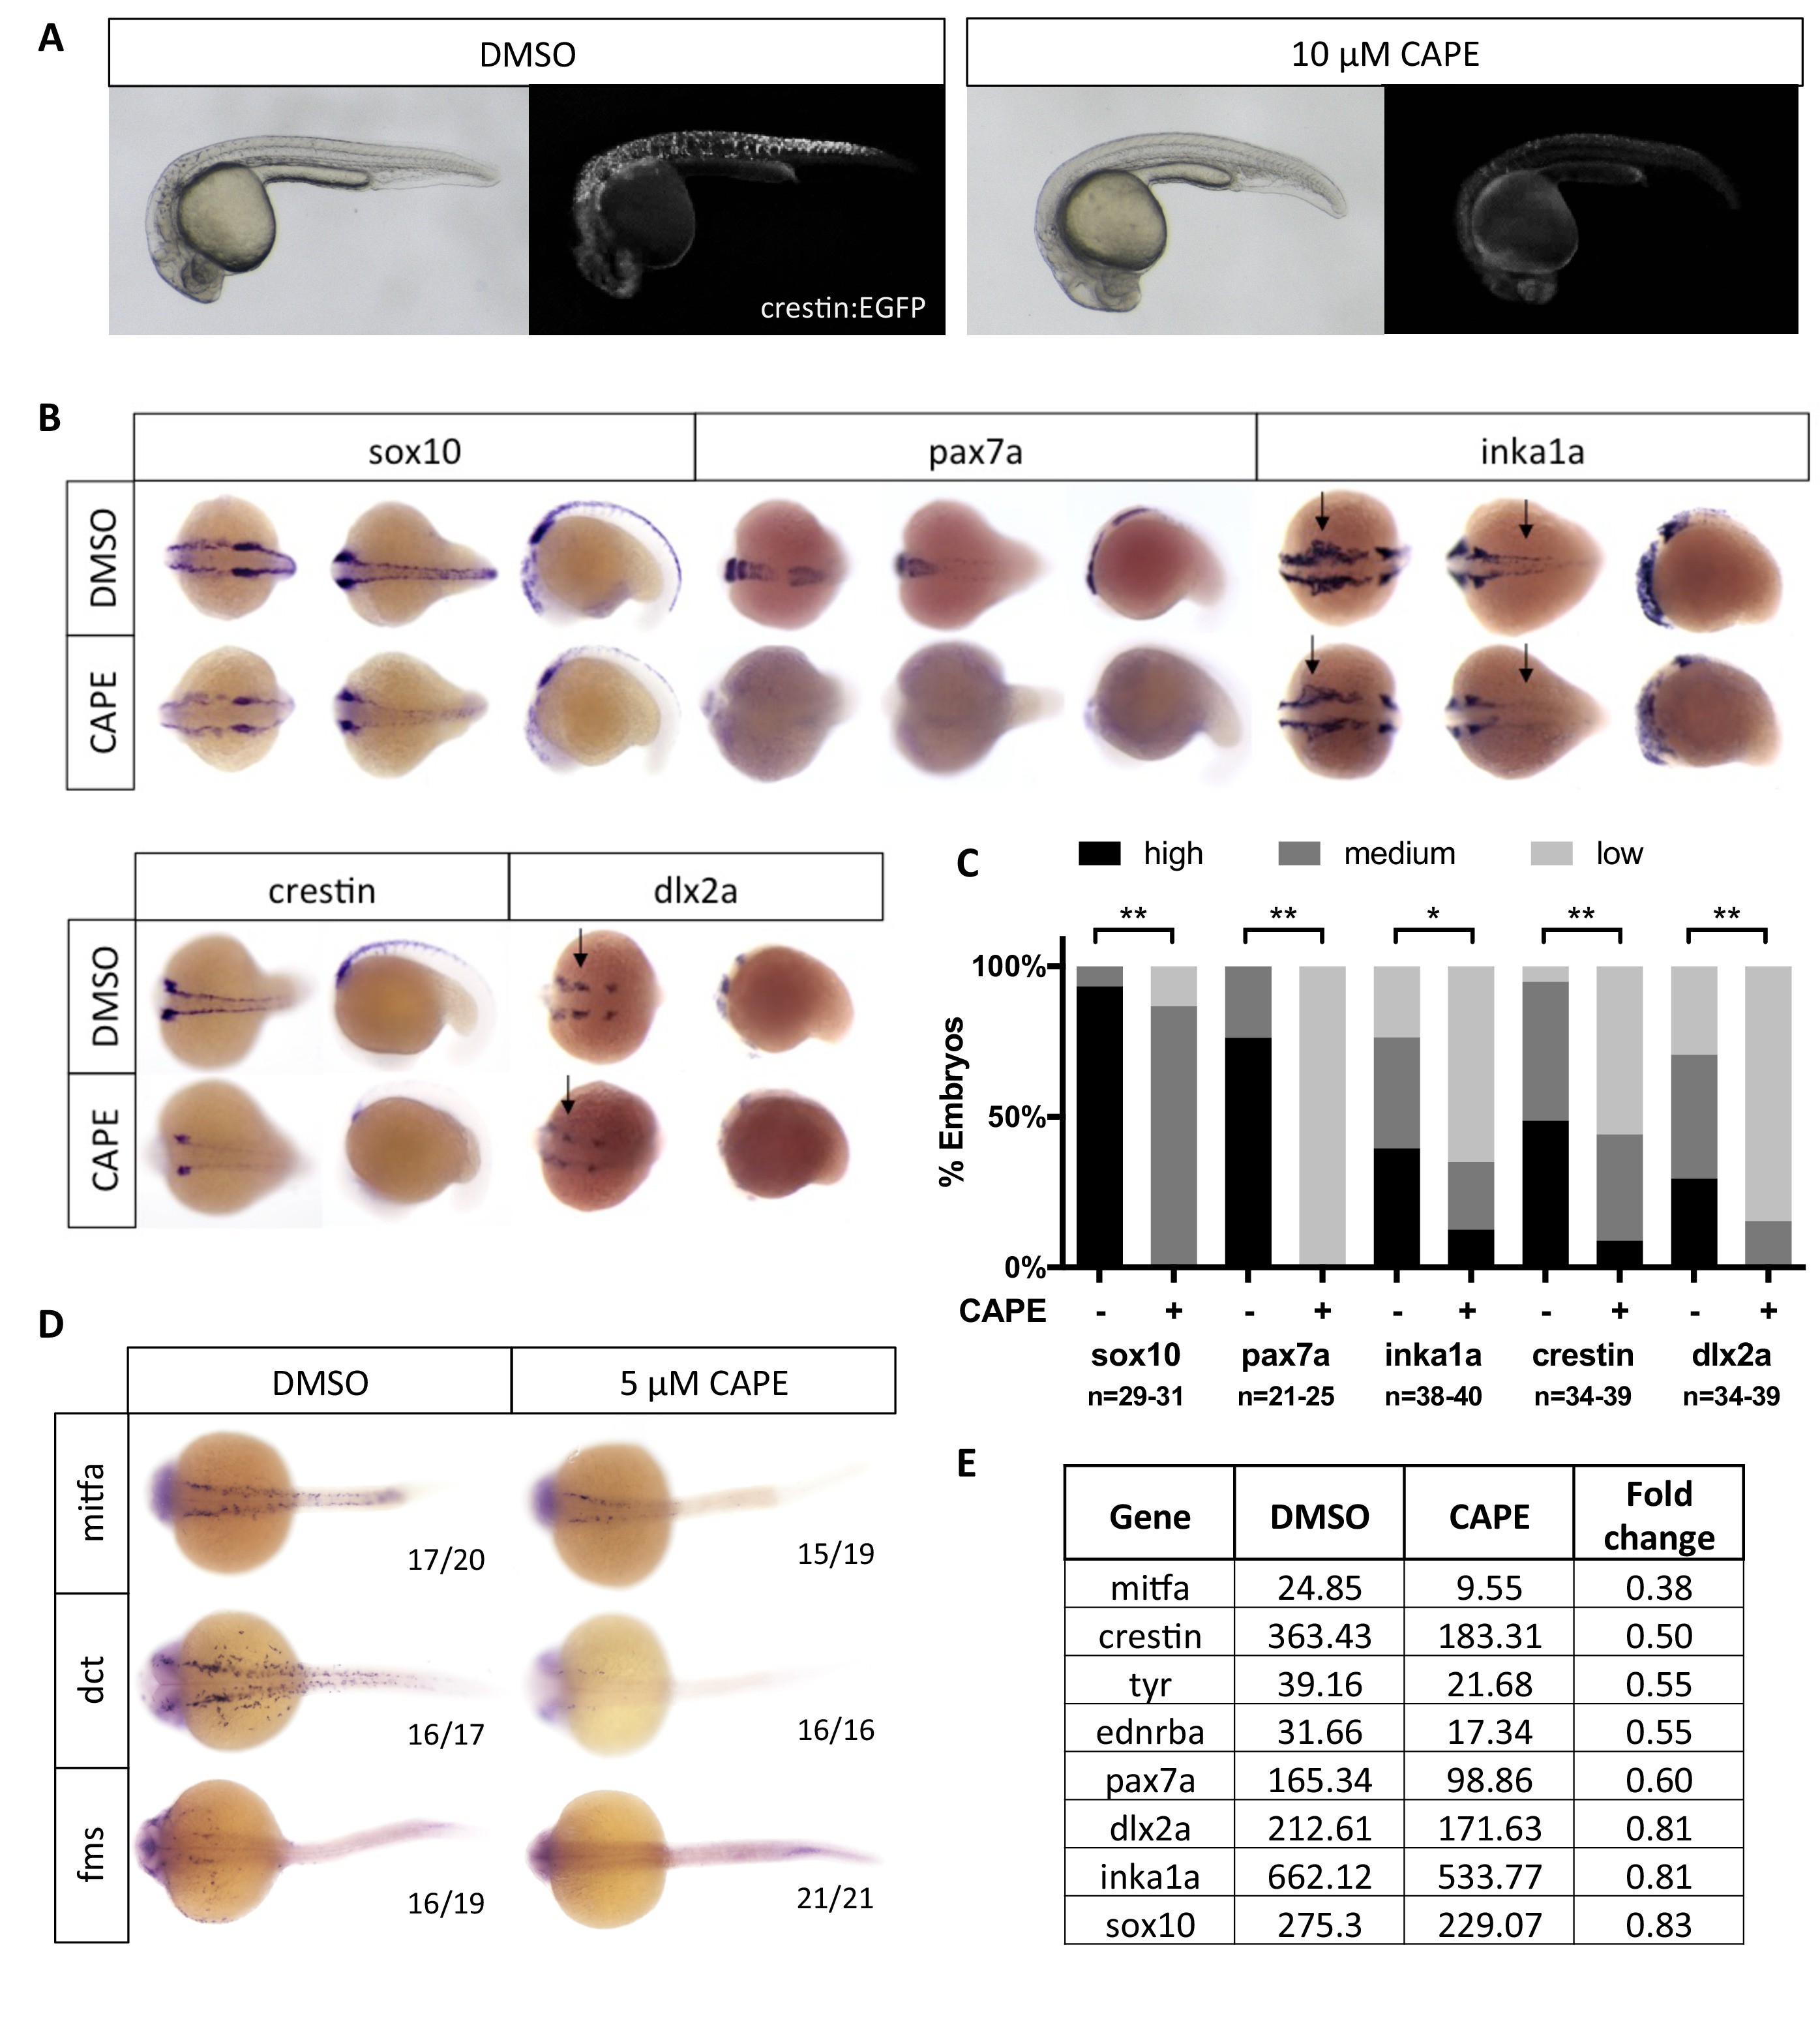
CAPE decreases neural crest gene expression.
(A) CAPE dramatically reduces crestin:EGFP expression at 26 hpf. Figure 2—figure supplement 1 shows the response of a smaller (396 bp) crestin promoter fragment to CAPE and the timing of crestin response to CAPE. (B) CAPE decreases neural crest gene expression as determined by whole mount in situ hybridization (ISH) at 15–17 ss. Expression of some genes is decreased ubiquitously while others are only altered in specific anatomic locations (arrows). Images are representative of at least two independent experiments. (C) Scoring of ISH in (B). (D) CAPE reduces expression of pigment cell genes at 24 hpf. (E) FPKM values from RNA-sequencing of sox10:Kaede+ cells confirmed decreases in neural crest genes, though to a lesser extent than by ISH. Cells were sorted from control or CAPE-treated embryos at 17 ss. Figure 2—figure supplement 2 shows neural crest genes with no significant change by ISH. Figure 2—figure supplement 3 shows that a change in cell number does not account for neural crest gene expression changes. Figure 2—figure supplement 4 shows other gene expression changes in neural crest cells. *p<0.001, **p<0.0001, chi-square test.