
Fig. 4
|
Fig. 4
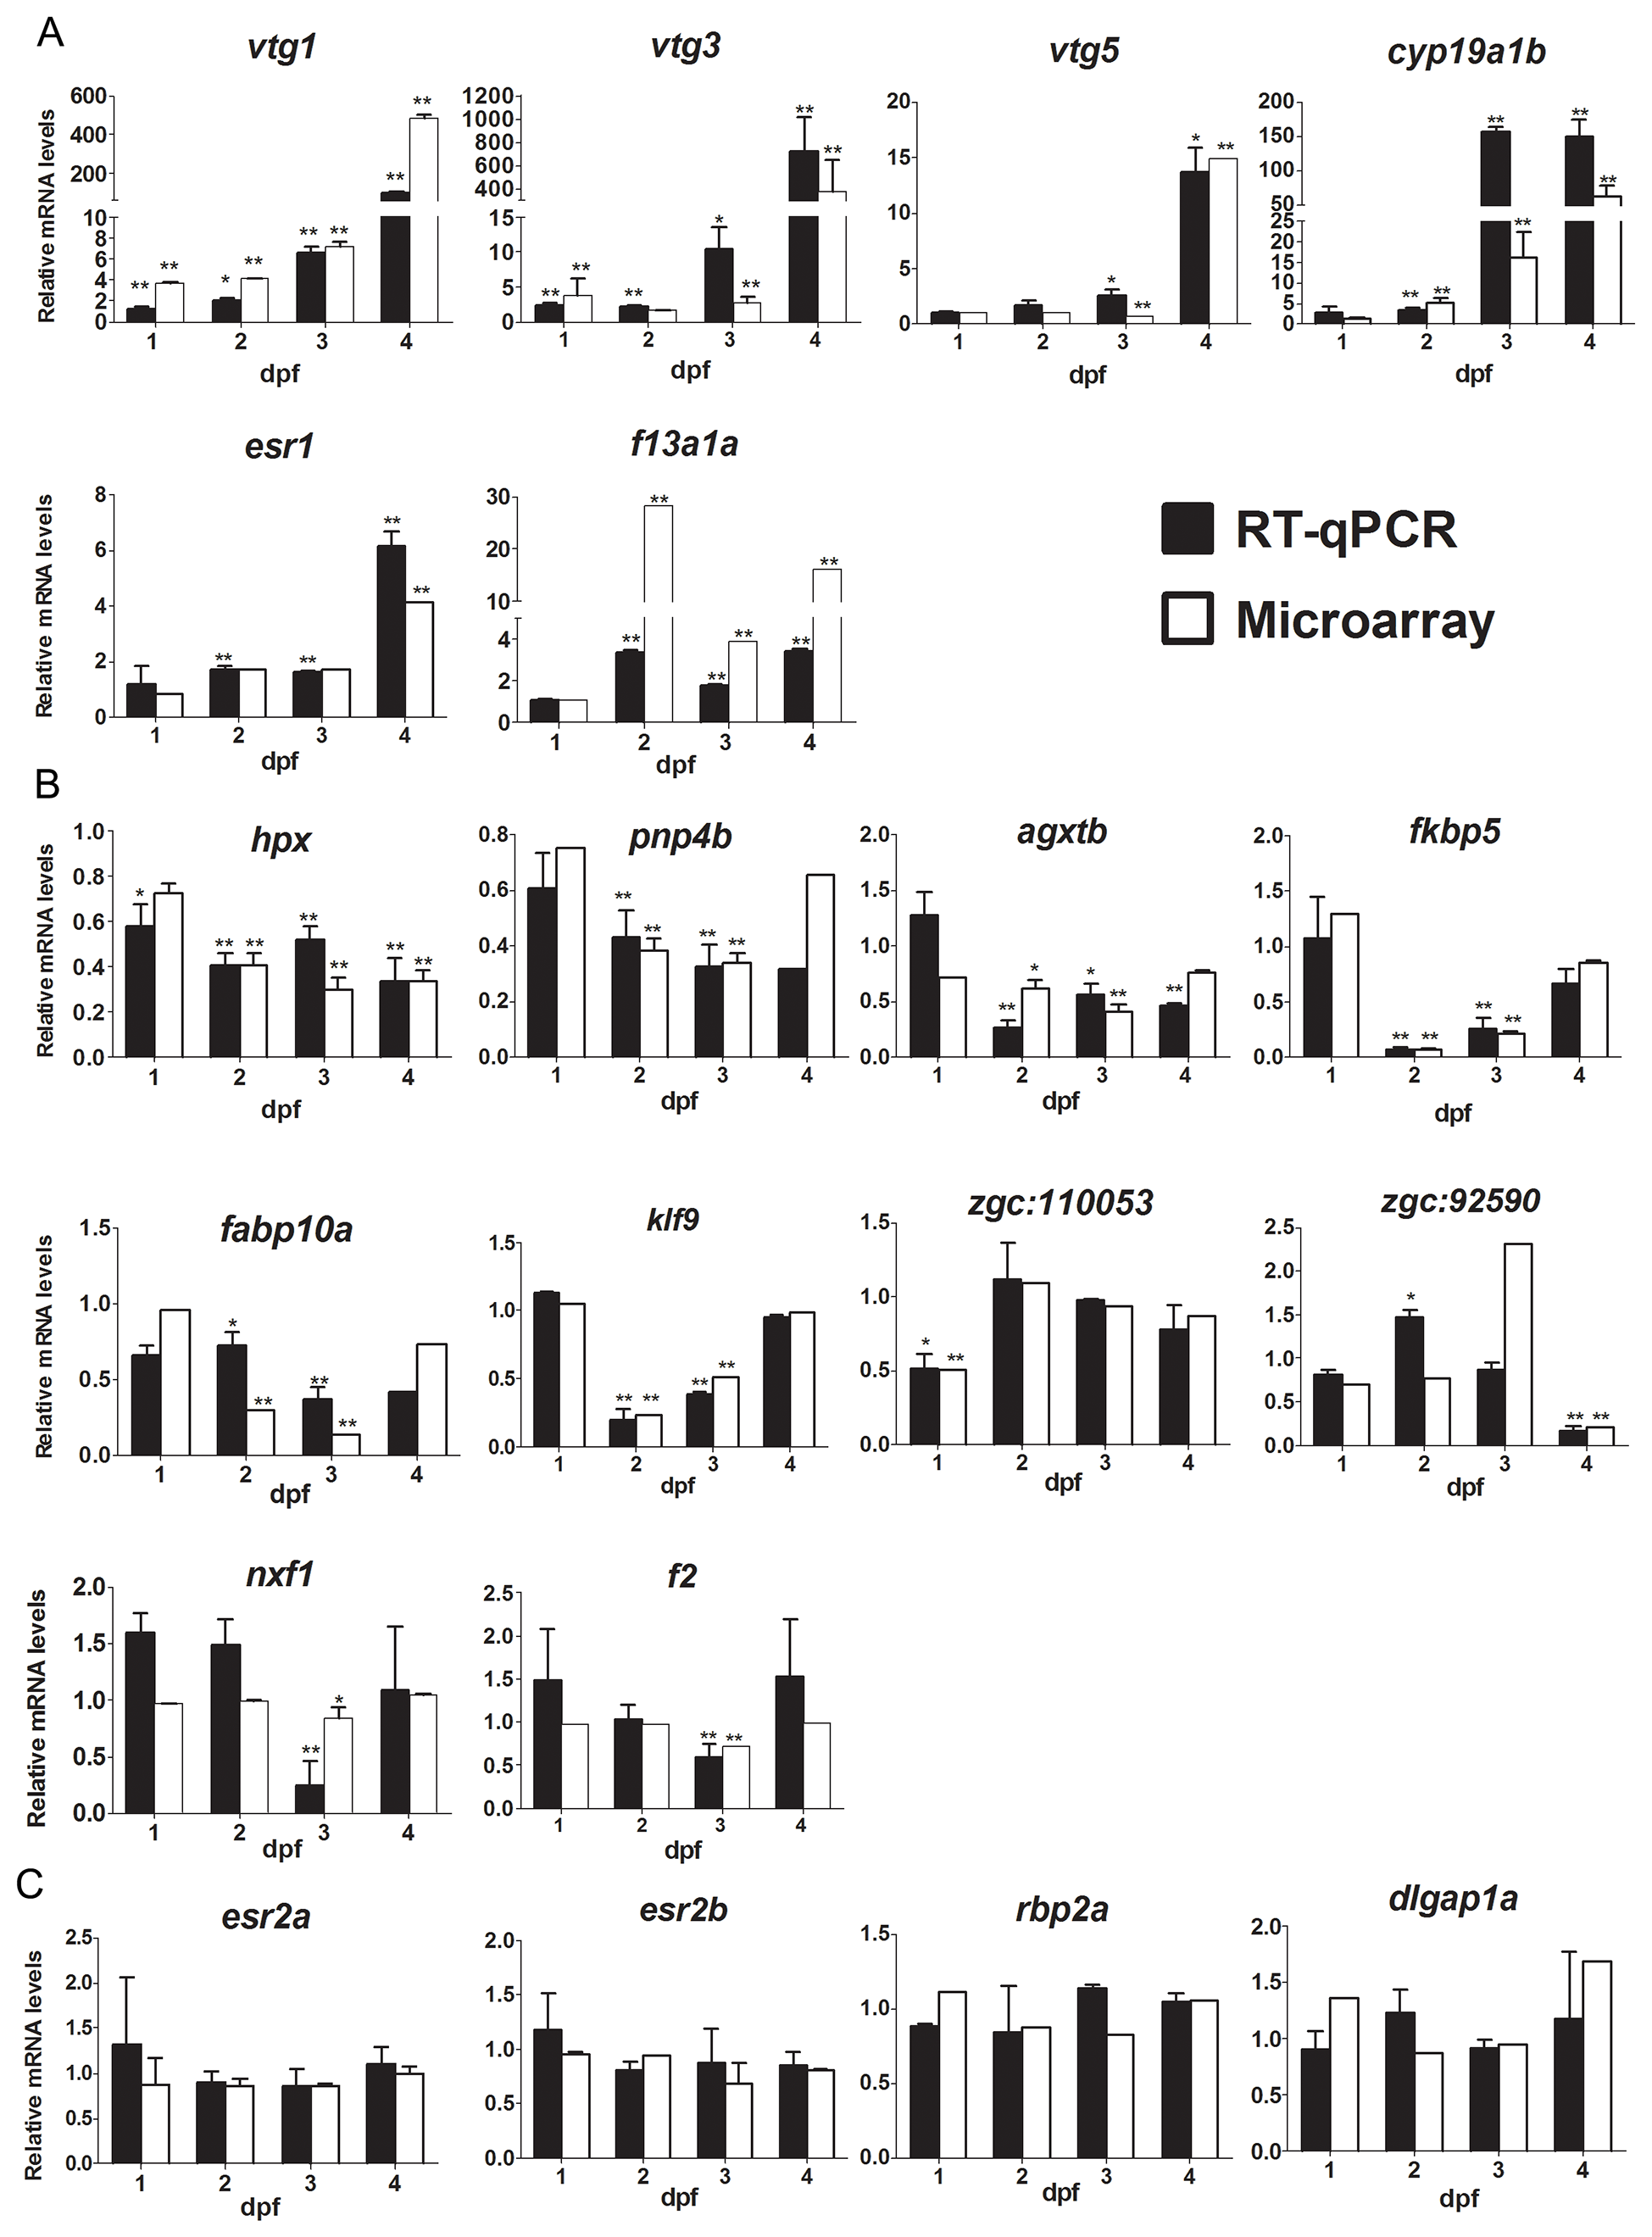
Comparison of E2 regulated genes analyzed by microarray or RT-qPCR.
(A) Relative mRNA expression of the up-regulated genes vtg1, vtg3, vtg5, esr1, cyp19a1b and f13a1a at different time points as determined by RT-qPCR and microarray analysis. (B) Relative mRNA expression of the down-regulated genes hpx, fkbp5, fabp10a, agxtb, pnp4b, nlf1, f2, klf9, zgc: 92590 and zgc: 110053 at different time points as determined by RT-qPCR and microarray analysis. (C) Relative mRNA expression of the non-changed genes esr2a, esr2b, rbp2a and dlgap1a at different time points as determined by RT-qPCR and microarray analysis. White bars represent microarray results and black bars RT-qPCR results. Asterisk denotes significant difference (*P<0.05, **P<0.01; unpaired Student’s t-test compared to the controls), n≥3 biological replicates except for genes fabp10a, agxtb and zgc:110053 which were 2 biological replicates ; each replicate consists of 30 pooled embryos. Abbreviations vtg1: vitellogenin 1; vtg3: vitellogenin 3; vtg5: vitellogenin 5; esr1: estrogen receptor 1; esr2a: estrogen receptor 2a; esr2b: estrogen receptor 2b; cyp19a1b: cytochrome P450, family 19, subfamily A, polypeptide 1b; f13a1a: coagulation factor XIII, A1 polypeptide a, tandem duplicate 1; hpx: hemopexin; fkbp5: FK506 binding protein 5; fabp10a: fatty acid binding protein 10a; agxtb: alanine-glyoxylate aminotransferase b; pnp4b: purine nucleoside phosphorylase 4b; nxf1: nuclear RNA export factor 1; klf9: krueppel-like factor 9; f2: coagulation factor II (thrombin); rbp2a: retinol binding protein 2a and dlgap1a: discs, large (Drosophila) homolog-associated protein 1a.