
Fig. 2
|
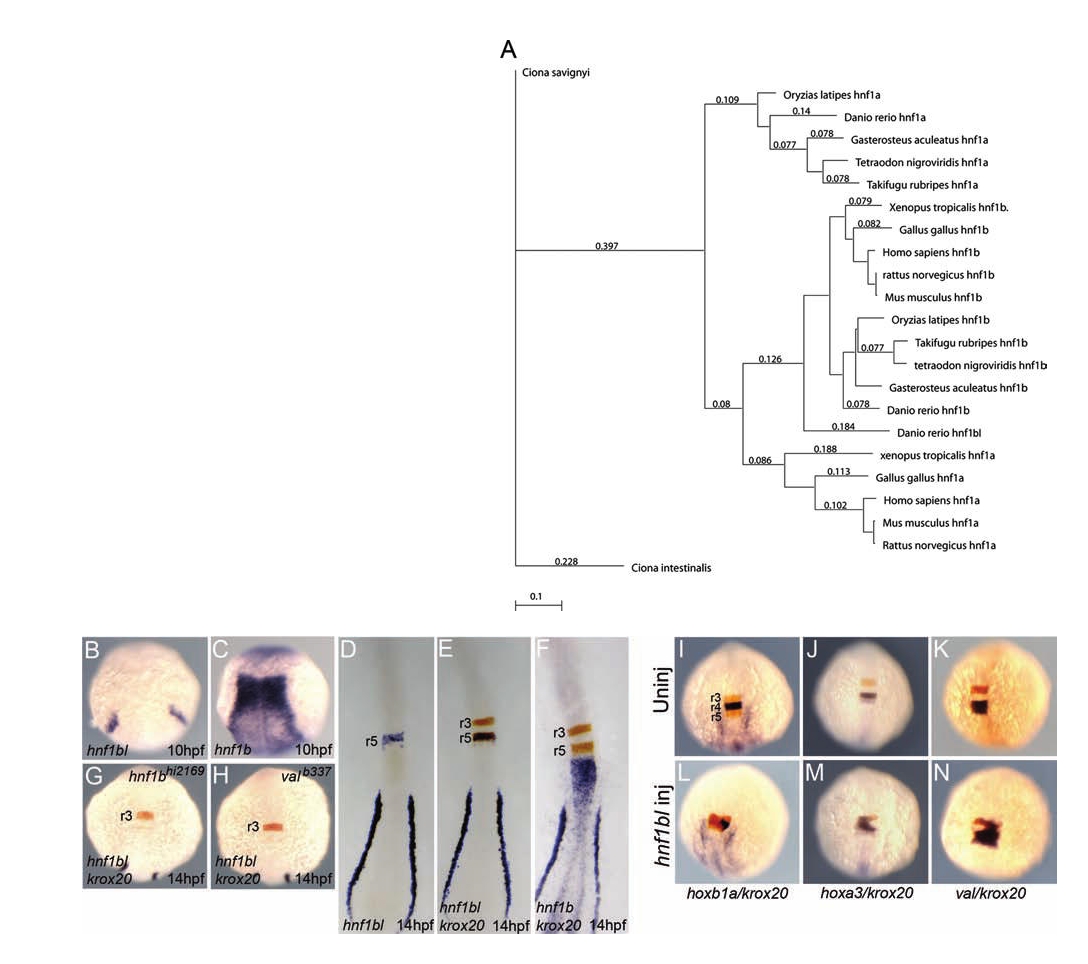
Fig. 2 A novel hnf1bl gene expressed in r5. (A) Phylogenetic tree demonstrating that hnf1bl clusters with hnf1b genes rather than hnf1a genes. (B–H) Wild-type (B–F), hnf1bhi2169 (G), and valb337 (H) embryos were assayed for expression of hnf1bl (B, D), hnf1b (C), hnf1bl+krox20 (E, G, H), or hnf1b+krox20 (F) by in situ hybridization. Note that hnf1b and hnf1bl are detected in blue, while krox20 is detected in red. (B), (C), (G), and (H) are whole mounts while (D), (E), and (F) are flat mounts. Anterior is to the top in all panels. (I–N) Uninjected (I–K) and hnf1bl-injected (L–N) wild-type embryos were assayed for expression of hoxb1a+krox20 (I, L), hoxa3+krox20 (J, M), or val+krox20 (K, N). Note that hoxb1a, hoxa3, and val are detected in blue, while krox20 is detected in red. All embryos are whole mounts in dorsal view with anterior to the top.