
Image
|
Figure Caption
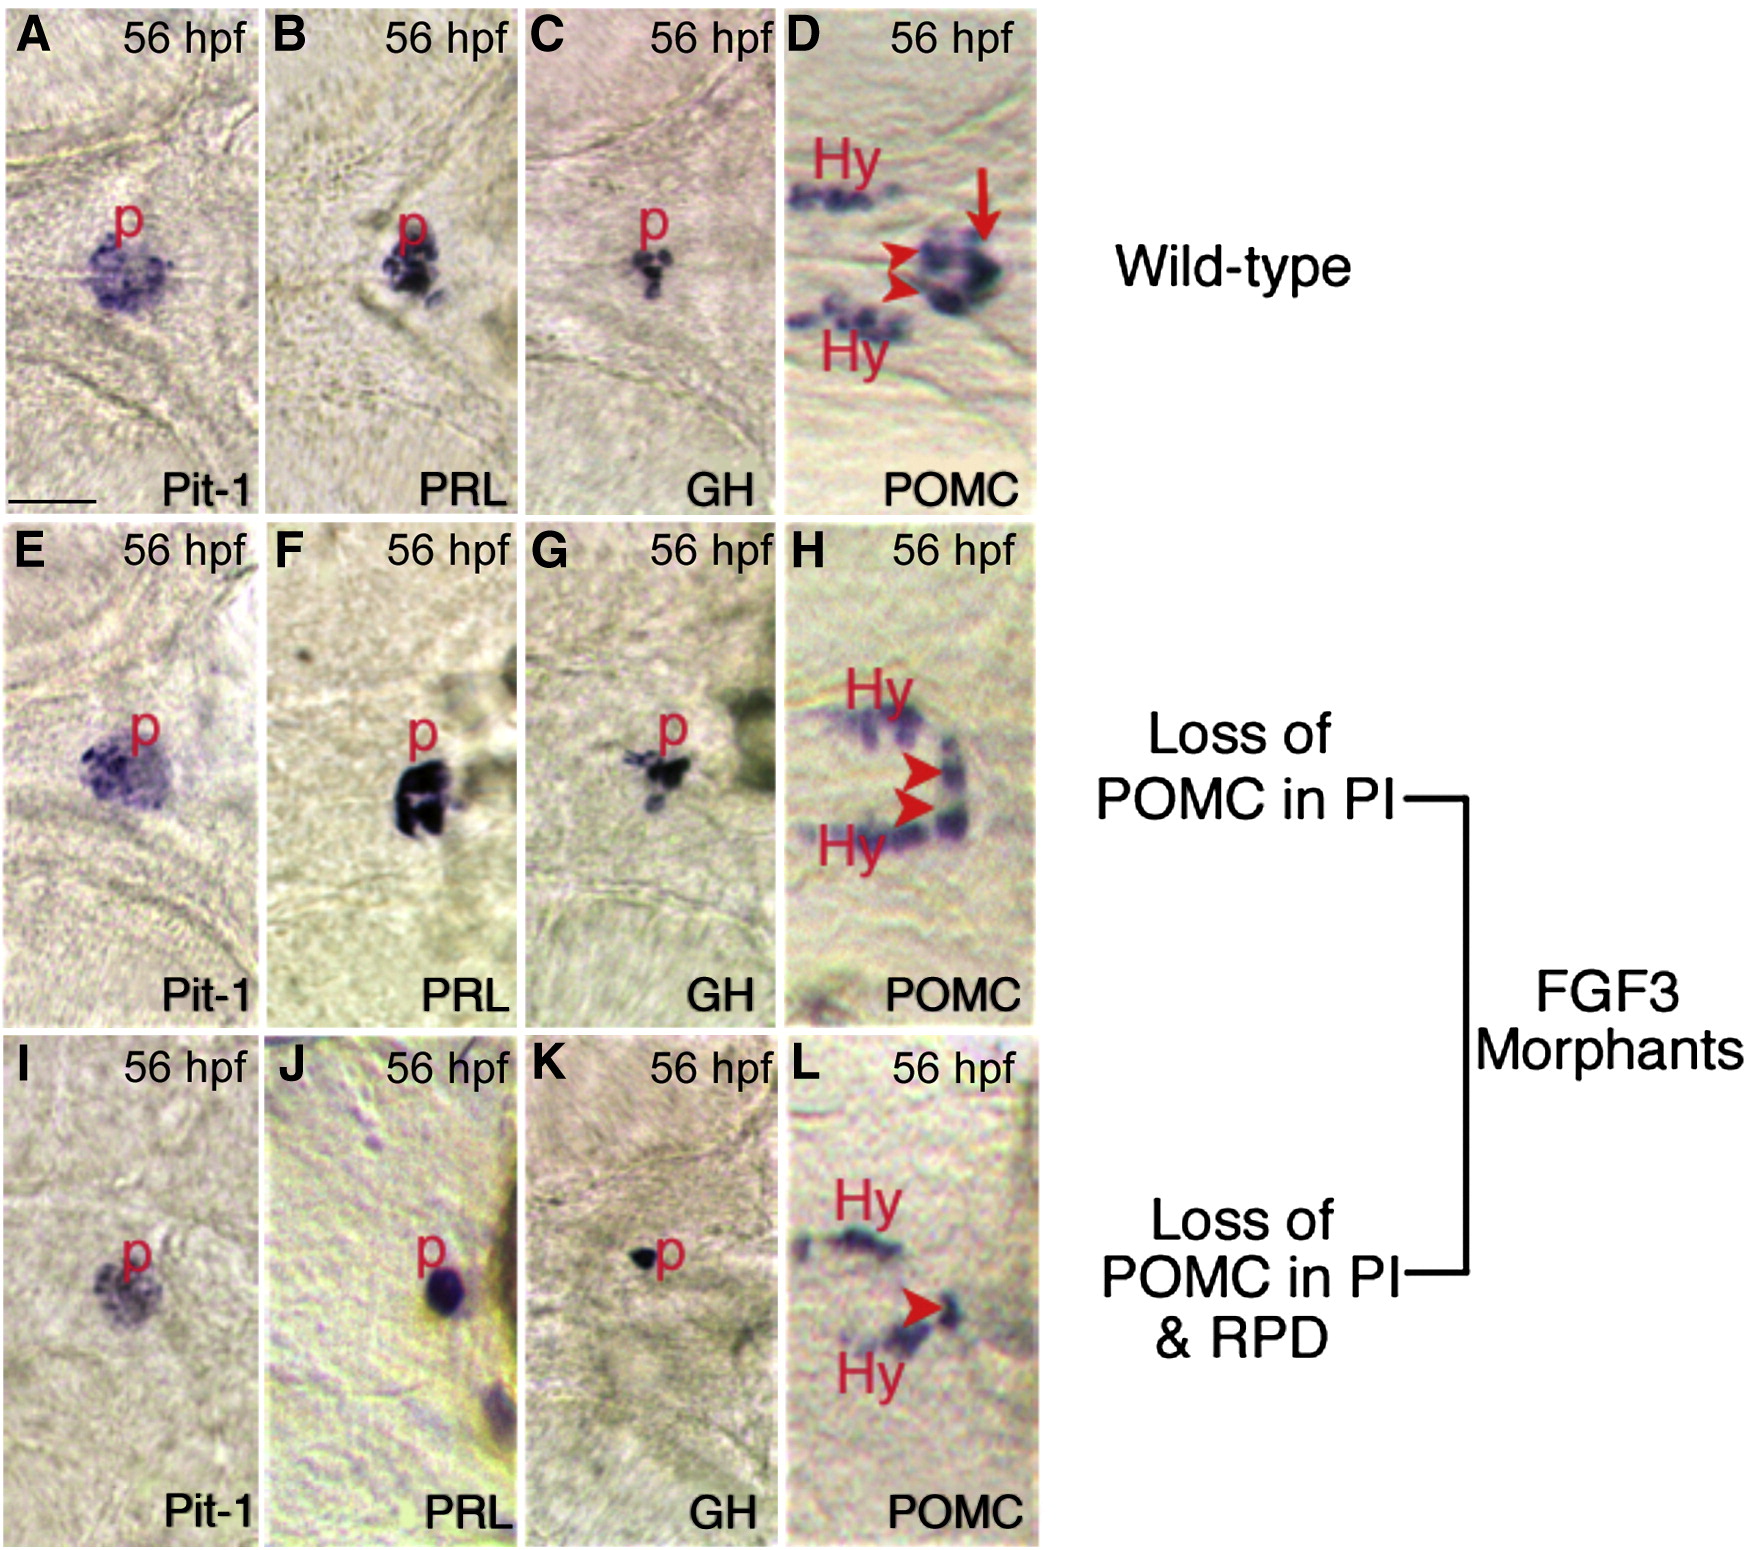
Fig. 3 Expression of Prl, Gh, and Pit-1 in FGF3 morphants are intact. In situ hybridization at 56 hpf using probes indicated in the lower right corner of each panel. (A–D) Wild type embryos. (E–H) Low dose FGF3 morphants with diminished POMC-GFP expression in the pars intermedia. (I–L) High dose FGF3 morphants with diminished POMC-GFP expression in the pars intermedia and rostral pars distalis. Ventral view of head, anterior to the left. Arrowheads, RPD. Arrow, PI. P, pituitary; Hy, hypothalamic POMC cells. Scale bar, 50 μm.
Figure Data
Acknowledgments
This image is the copyrighted work of the attributed author or publisher, and
ZFIN has permission only to display this image to its users.
Additional permissions should be obtained from the applicable author or publisher of the image.
Reprinted from Developmental Biology, 319(2), Liu, N.A., Ren, M., Song, J., Ríos, Y., Wawrowsky, K., Ben-Shlomo, A., Lin, S., and Melmed, S., In vivo time-lapse imaging delineates the zebrafish pituitary proopiomelanocortin lineage boundary regulated by FGF3 signal, 192-200, Copyright (2008) with permission from Elsevier. Full text @ Dev. Biol.