
Fig. 7
|
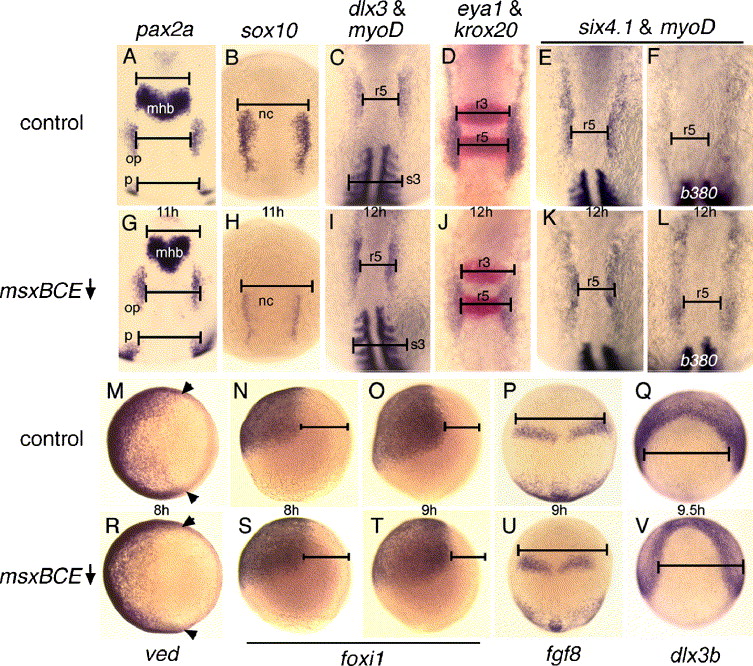
Fig. 7 Positioning of the neural border is regulated by opposing activities of msx and dlx genes. (A, G) pax2a expression in the otic placode (op), midbrain–hindbrain border (mhb) and pronephros (p) at 11 hpf in a control embryo (A) and msxBCE morphant (F). (B, H) sox10 expression in neural crest (nc) at 11 hpf in a control embryo (B) and msxBCE morphant (H). (C, I) Expression of dlx3b and myoD at 12 hpf in a control embryo (C) and msxBCE morphant (I). (D, J) Expression of eya1 (blue) and krox20 (red) at 12 hpf in a control embryo (D) and msxBCE morphant (J). (E, F, K, L) Expression of six4.1 and myoD at 12 hpf in a wild-type embryo (E), msxBCE morphant (K), a b380/b380 mutant (F), and a b380/b380 mutant injected with msxBCE-MO (L). b380 mutants were unambiguously identified by the absence of clearly defined somite boundaries. (M, R) Animal pole views showing expression of the ventral marker ved (Shimizu et al., 2002) at 8 hpf in a control embryo (M) and msxBCE morphant (R). Arrowheads mark the dorsal limit of expression. (N, O, S, T) Lateral views of foxi1 expression in ventral ectoderm in control embryos at 8 hpf (N) and 9 hpf (O) and msxBCE morphants at 8 hpf (S) and at 9 hpf (T). (P, U) Expression of fgf8 in the hindbrain at 9 hpf in a control (P) and msxBCE morphant (U). (Q, V) Expression of dlx3b in preplacodal ectoderm at 9.5 hpf in a control (Q) and msxBCE morphant (V). To facilitate comparisons, black bars show the normal width (as measured in control embryos) of the indicated regions. Bars are aligned on the left side but extend past the structures on the right in msxBCE morphants, revealing the degree of neural plate reduction. Abbreviations: mhb, midbrain–hindbrain border; nc, neural crest; op, otic placode; p, pronephros; r3, rhombomere 3; r5, rhombomere 5; s3, somite 3. Unless otherwise indicated, images show dorsal views with anterior to the top.
Reprinted from Developmental Biology, 294(2), Phillips, B.T., Kwon, H.J., Melton, C., Houghtaling, P., Fritz, A., and Riley, B.B., Zebrafish msxB, msxC and msxE function together to refine the neural-nonneural border and regulate cranial placodes and neural crest development, 376-390, Copyright (2006) with permission from Elsevier. Full text @ Dev. Biol.