|
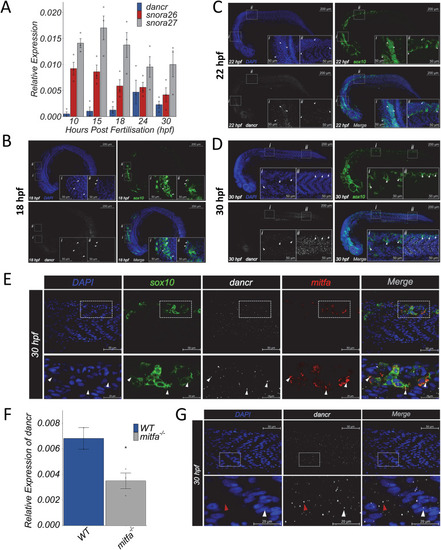
Dancr is dynamically expressed in multiple tissues and cell types in the developing zebrafish embryo. Dancr, snora26 and snora27 are expressed during early embryonic development in zebrafish. (A)Dancr, snora26 and snora27 expression levels were measured in whole zebrafish embryos at the indicated developmental stages between 10-30 hpf using RT-qPCR. actb2 was used as a reference gene. Spearman rank correlation showed that there is no association between expression of dancr and either snora26 (R = 0.064, p = 0.82) or snora27 (R = 0.054, p = 0.85). (B, C, D)Dancr is dynamically expressed in multiple tissues and cell types during zebrafish embryogenesis. Zebrafish dancr RNA transcripts were detected using RNAscope ISH on fixed embryos at 18 hpf (B), 22 hpf (C) and 30 hpf (D). Embryos are shown in lateral view. Confocal imaging of dancr (white), GFP expressing NCCs (green), nuclear DAPI (blue) and merged channels are shown. A 20X objective was used to obtain the representative images presented. Each representative image is derived from an individual Z-slice from the same embryo. White arrow heads indicate examples of neural crest cells expressing dancr. Scale bar = 200μm. Inset scale bar = 50μm. (E) A subset of melanoblasts co-express mitfa and dancr. RNAscope ISH detection of dancr (white) and mitfa (red) and immunofluorescence labelling of sox10 (GFP) positive NCCs and derivatives (green) in the tail of 30hpf zebrafish embryos. A 63X objective was used to obtain representative images from an individual focal plane in a 3D projection. Embryos are presented laterally with the orientation of the head to the left. White arrow heads indicate examples of co-expression of mitfa and dancr within sox10 positive melanoblasts. Scale bar = 50μm. Inset bar = 20μm. (F)Dancr expression was measured in nacre mutant (mitfa-/-) and wild type whole zebrafish embryos at 30 hpf using RT-qPCR. actb1 was used as a reference gene. (G)Dancr transcript is enriched in the cytoplasm of cells in the developing zebrafish development. RNAscope ISH detecting dancr (white) and DAPI staining (blue) in the tail region of a single embryo at 30 hpf using a 63X objective. Embryos are shown in lateral view. Representative confocal image derived from an individual focal plane. The white and red arrowheads indicate nuclear and cytoplasmic dancr expression respectively. Scale bar = 50μm. Inset bar = 20μm.
|