
Fig. 6
- ID
- ZDB-FIG-251107-10
- Publication
- Ramírez et al., 2025 - The Smarce1 subunit of the BAF complex performs distinct, stage-specific functions during zebrafish retinal development
- Other Figures
- All Figure Page
- Back to All Figure Page
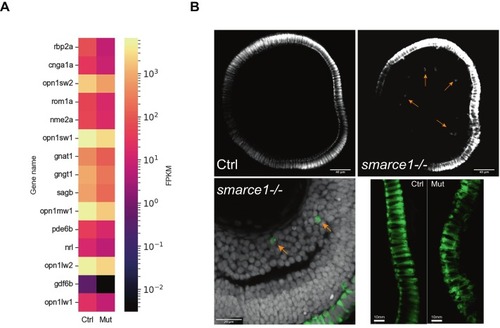
Terminal differentiation of PRs is defective. (A) Heatmap showing the top downregulated genes of the Phototransduction Term. The bar shows the average FPKM value of three replicates. Yellow color indicates a high expression level, and black color indicates a low expression level. Genes are organized according to their Padj value from small to large (range 3.8–64 to 0.00749). (B) Confocal sections of 5 dpf Ctrl and smarce1-/- retinas stained with the Zpr1 antibody (green). Ectopic cones are visible in inner locations (yellow arrows) in the mutant images. Right lower panel shows a closer caption of the PRs where disorganization can be appreciated. Scale bars, upper panel:40 μm; left lower panel: 20 μm; right lower panel: 10 μm. (For interpretation of the references to colour in this figure legend, the reader is referred to the web version of this article.) |