
Fig. 3
- ID
- ZDB-FIG-251107-7
- Publication
- Ramírez et al., 2025 - The Smarce1 subunit of the BAF complex performs distinct, stage-specific functions during zebrafish retinal development
- Other Figures
- All Figure Page
- Back to All Figure Page
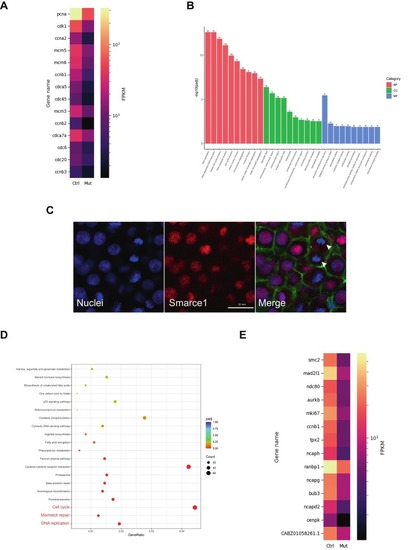
Transcriptomic analysis of smarce1-mutant retinas confirms downregulation of cell cycle and mitosis genes. (A) Heatmap showing a list of the top downregulated genes of the Cell Cycle Term. The color bar shows the average FPKM value of three replicates. Yellow color indicates a high expression level, and black color indicates a low expression level. Genes are organized according to their Padj value from small to large (range 1.53e-57 to 3.7e-08). (B) GO enrichment analysis. The most significant 30 Terms were selected for display; the x-axis indicates GO Term, and the y-axis displays GO Term's level of significance of enrichment, expressed as −log10 (padj). Different colors represent different functional categories; BP: biological processes, CC: cell components, MF: molecular function. (C) Confocal images showing immunodetection of Smarce1 in embryos at the oblong stage (3.7 hpf). DAPI staining (blue) labels nuclei in S-phase and chromosomes at mitosis. Phalloidin (green) marks the cell cortex. Smarce1 signal (red) is localized to nuclei but is absent from mitotic chromosomes. Late anaphase/early telophase chromosomes in a dividing cell are indicated (white arrow heads). Scale bar: 20 μm. (D) KEGG enrichment results showing that the top downregulated pathways are related to the cell cycle (red characters); the most significant 20 KEGG downregulated pathways are displayed. The x-axis represents the ratio of the number of differential genes linked with the KEGG pathway to the total number of differential genes; the y-axis lists the KEGG pathways. The size of a point represents the number of genes annotated to a specific KEGG pathway. The color from red to purple represents the significant level of enrichment. (E) Heatmap showing the top downregulated genes of the Mitosis Term. The bar shows the average FPKM value of three replicates. Yellow color indicates a high expression level, and black color indicates a low expression level. Genes are organized according to their Padj value from small to large (range 1.32e-36 to 3.3e-18). (For interpretation of the references to colour in this figure legend, the reader is referred to the web version of this article.) |