
Fig. 8
- ID
- ZDB-FIG-251003-38
- Publication
- Lemée et al., 2025 - Disrupted transcriptional networks regulated by CHD1L during neurodevelopment underlie the mirrored neuroanatomical and growth phenotypes of the 1q21.1 copy number variant
- Other Figures
- All Figure Page
- Back to All Figure Page
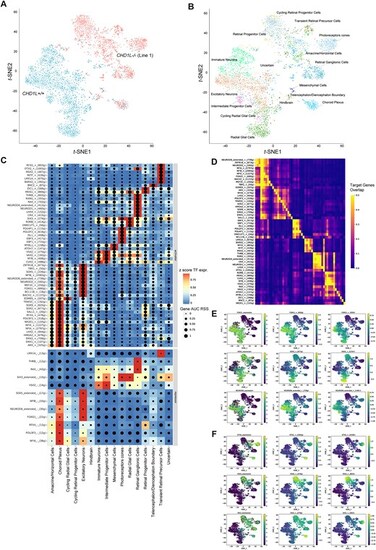
SCENIC + analysis reveals CHD1L function in forebrain cell-fate determination. (A) t-SNE dimensionality reduction of 4019 cells based on gene and target region enrichment scores of eRegulons. Cells are colored according to their genotypes CHD1L+/+ and CHD1L−/− and were analyzed for gene expression and chromatin accessibility in 60-day in vitro hCO. (B) t-SNE dimensionality reduction of organoid cells based on gene and target region enrichment scores of eRegulons. Cells are colored according to their identity. (C) Heatmap/dot-plot showing transcription factor (TF) expression of the eRegulon on a color scale and cell-type specificity (RSS) of the eRegulon on a size scale. Cell types are ordered on the basis of their gene expression similarity. (D) Overlap of target genes of eRegulons. The overlap is divided by the number of target genes of the eRegulon in each row. (E) Representative t-SNE dimensionality reduction of multiome dataset colored based on TF expression, target gene and region activity of eRegulons for telencephalic markers (FOXG1, SOX2, NEUROD6). (F) Representative t-SNE dimensionality reduction of multiome dataset colored based on TF expression, target gene and region activity of eRegulons for retinal markers (OTX2, VSX2, SIX3). AUC, area under the recovery curve; g, gene; r, region; RSS, eRegulon specificity score; TF, transcription factor. |